# 有监督学习
# 检查结果自动判定
# 文献 1 - 皮肤病自动诊断
Esteva A , Kuprel B , Novoa R A , et al. Dermatologist-level classification of skin cancer with deep neural networks[J]. Nature, 2017, 542(7639):115-118.
标题: Dermatologist-level classification of skin cancer with deep neural networks
皮肤科专家级别的深度神经网络对皮肤癌进行分类原始数据:129,450 图片
分割训练集和测试集:127463:1942调用的算法模型:End to End CNN Inception V3 卷积神经网络
卷积神经网络模型有很多层,比如 16 层 / 34 层的算法,一般是指卷积神经网络模型,只要符合该算法结构的都可以被称为卷积神经网络
Inception V3 是谷歌优化参数后的,在医学领域应用比较多解决问题:皮肤科临床最常见的肿瘤和最恶性的肿瘤的辅助诊断
- 角质细胞癌 VS 良性脂溢性角化病
- 恶性黑色素瘤 VS 普通的痣
# 心电图自动诊断
Awni Y, Hannun, Pranav,et al. Cardiologist-level arrhythmia detection and classification in ambulatory electrocardiograms using a deep neural network.[J]. Nature medicine, 2019.
标题:Cardiologist-level arrhythmia detection and classification in ambulatory electrocardiograms using a deep neural network
心脏病专家级别的深度神经网络对动态心电图中的心律失常进行检测和分类收集数据,数据来源于公共数据库
91232 单导联 ECG调用的算法模型:End to End DNN (自己编辑的)
解决问题:12 个心律失常类别
# 非小细胞肺癌诊断
Nicolas C , Santiago O P , Theodore S , et al. Classification and mutation prediction from non–small cell lung cancer histopathology images using deep learning[J]. Nature Medicine, 2018.
标题:Classification and mutation prediction from non–small cell lung cancer histopathology images using deep learning
非小细胞肺癌组织病理学图像使用深度学习进行分类和突变预测收集数据:
LUAD:LUSC:Normal
564:609:459非小细胞肺癌的两种类型 + 正常组的病理学图片
调用的算法模型:Inception V3
根据图片判断是哪种疾病拓展:Gene Mutation
根据图片判断具体属于哪种基因型
# 知识拓展
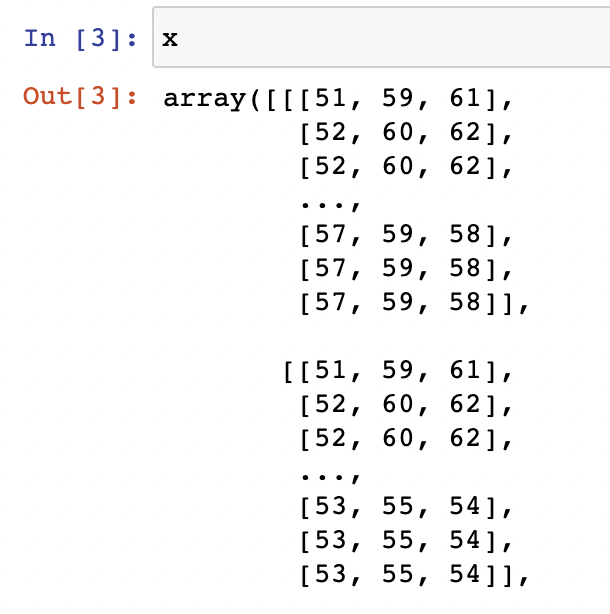
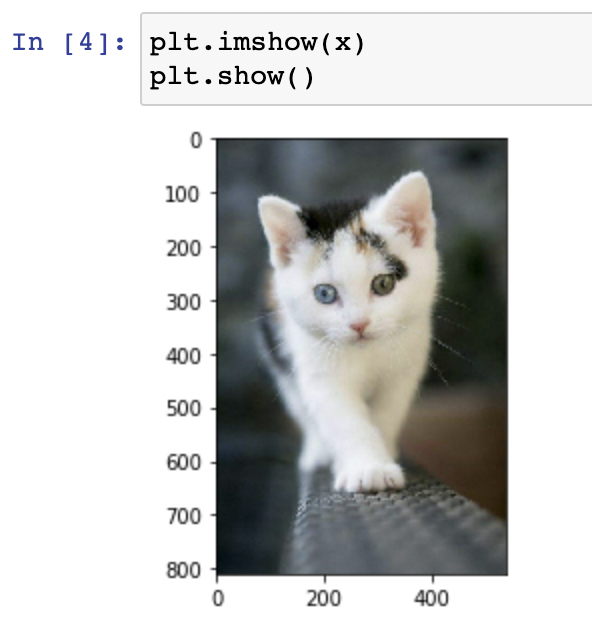
# 图片在 Python 中的形成
“彩色三原色” - 三维矩阵
“1 个像素点” [R, G, B] [125, 220, 240]
“1 行像素点”
[ [R, G, B], [R, G, B], [R, G, B],…]
[ [125, 220, 240], [125, 220, 240], [125, 220, 240]]
“x 行 * Y 列像素点”
[ [ [R, G, B], [R, G, B], [R, G, B],…]
[ [R, G, B], [R, G, B], [R, G, B],…]
….
[ [R, G, B], [R, G, B], [R, G, B],…] ]
import matplotlib.image as imgplt | |
import matplotlib.pyplot as plt | |
x = imgplt.imread('cat.jfif') | |
x | |
plt.imshow(x) | |
plt.show() |
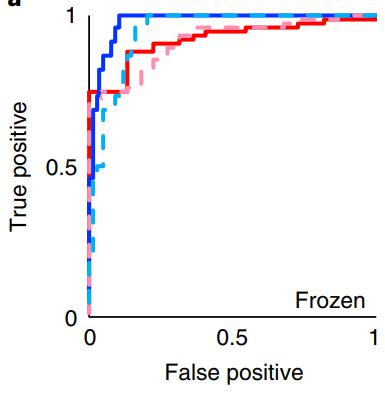
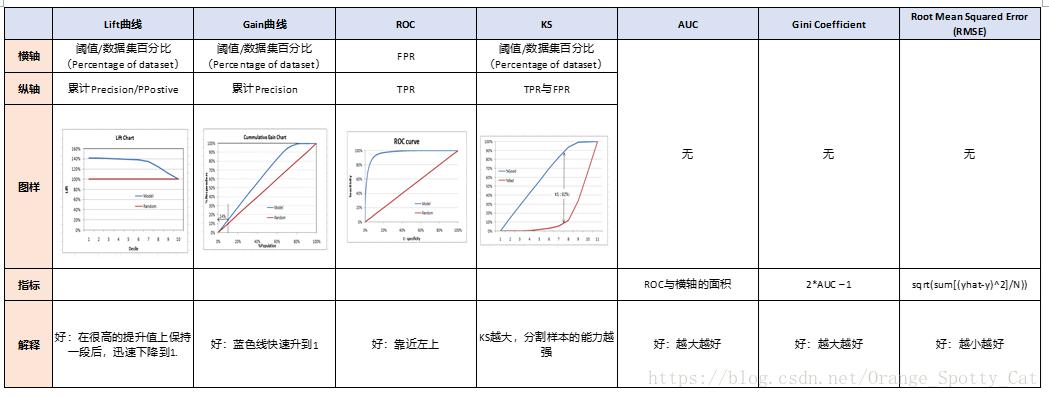
# 混淆矩阵 ROC 曲线
https://blog.csdn.net/Orange_Spotty_Cat/article/details/82425113
| Confusion Matrix | 真实值 Y | ||||
|---|---|---|---|---|---|
| Positive | Negative | ||||
| 预测值 Y Hat | Positive | TP | FP | Precision=PPV=TP/(TP+FP) | PPositive=P/ALL |
| Negative | FN | TN | NPV=TN/(FN+TN) | ||
Sensitivity=Recall=TPR | FPR=FP/(FP+TN) | ||||
| Accuracy=T/ALL | |||||
ROC 曲线通过 TPR 和 FPR 计算绘制
#计算 Logsitic 模型得分 | |
y_score = model_Log_SS.fit(train_X_SS, train_y).decision_function(test_X_SS) | |
y_score | |
#导入 ROC 模块 | |
from sklearn.metrics import roc_curve, auc | |
#计算 FPR,TPR | |
fpr,tpr,threshold = roc_curve(test_y, y_score) | |
test_y | |
#转换数据 | |
test_y_=test_y.replace(['M','B'], [1,0]) | |
#M 代表恶性肿瘤,B 代表良性肿瘤 | |
test_y_ | |
#计算 FPR,TPR | |
fpr,tpr,threshold = roc_curve(test_y_, y_score) | |
#导入画图包 | |
import matplotlib.pyplot as plt | |
#开始画图 | |
plt.figure() | |
#横坐标 fpr 纵坐标 tpr 颜色 blue | |
plt.plot(fpr, tpr, color='b') | |
#横坐标文字 | |
plt.xlabel('False Positive Rate') | |
#纵坐标文字 | |
plt.ylabel('True Positive Rate') | |
plt.title('ROC curve') | |
plt.show() | |
#计算 AUC | |
auc(fpr, tpr) | |
#------------- 以后 | |
#计算 Logistic 模型得分 | |
y_score=model_Log_SS.fit(train_X_SS, train_y).decision_function(test_X_SS) | |
y_score | |
#打印系数 | |
coefs = model_Log_SS.coef_ | |
coefs | |
#打印截距 | |
intercept = model_Log_SS.intercept_ | |
intercept | |
#导入 SVC 模型,训练模型 | |
from sklearn.svm import SVC | |
model_svc = SVC() | |
model_svc.fit(train_X_SS, train_y) | |
#预测测试集 | |
prediction_svc = model_svc.predict(test_X_SS) | |
#计算准确率 | |
metrics.accuracy_score(prediction_svc,test_y) | |
#计算 SVC 模型得分 | |
y_score_svc=model_svc.decision_function(test_X_SS) | |
y_score_svc | |
#打印系数 | |
print(model_svc.coef_) | |
#打印截距 | |
print(model_svc.intercept_) |
# 一些概念
"End to End" 端对端,不提取特征,直接将数据导入算法
数据要足够多
"Object——Feature——Model"
"Object——Model"
# 文献特点
- 数据集庞大,信息足够丰富
- 算法技术高端
- 数据目标明确,内容有创新