author: "Sonja Petrovic & Yuhan Ding"

# Objectives 目标

What is the purpose of these notes?
这些笔记的目的是什么?

  1. Introduce you to how to run R code in RStuidio' from within a Markdown document;
    介绍如何从 Markdown 文档中在 RStudio 中运行 R 代码;
  2. Give you the basic R syntax and structure;
    基本的 R 语法和结构;
  3. Provide a tiny Markdown example.
    提供一个很小的 ​​Markdown 示例。

# Context 内容

Reminder about why we use Markdown:
为什么使用 Markdown:

# Flexibility & reproducibility

  • R Markdown allows the user to integrate R code into a report
    R Markdown 允许用户将 R 代码集成到报告中
  • When data changes or code changes, so does the report
    当数据更改或代码更改时,报告也会更改
  • No more need to copy-and-paste graphics, tables, or numbers
    不再需要复制和粘贴图形、表格或数字
  • Creates reproducible reports
    创建可重复的报告
  • Anyone who has your R Markdown (.Rmd) file and input data can re-run your analysis and get the exact same results (tables, figures, summaries)
    任何拥有你的 R Markdown (.Rmd) 文件和输入数据的人都可以重新运行你的分析并获得完全相同的结果(表格、数字、摘要)
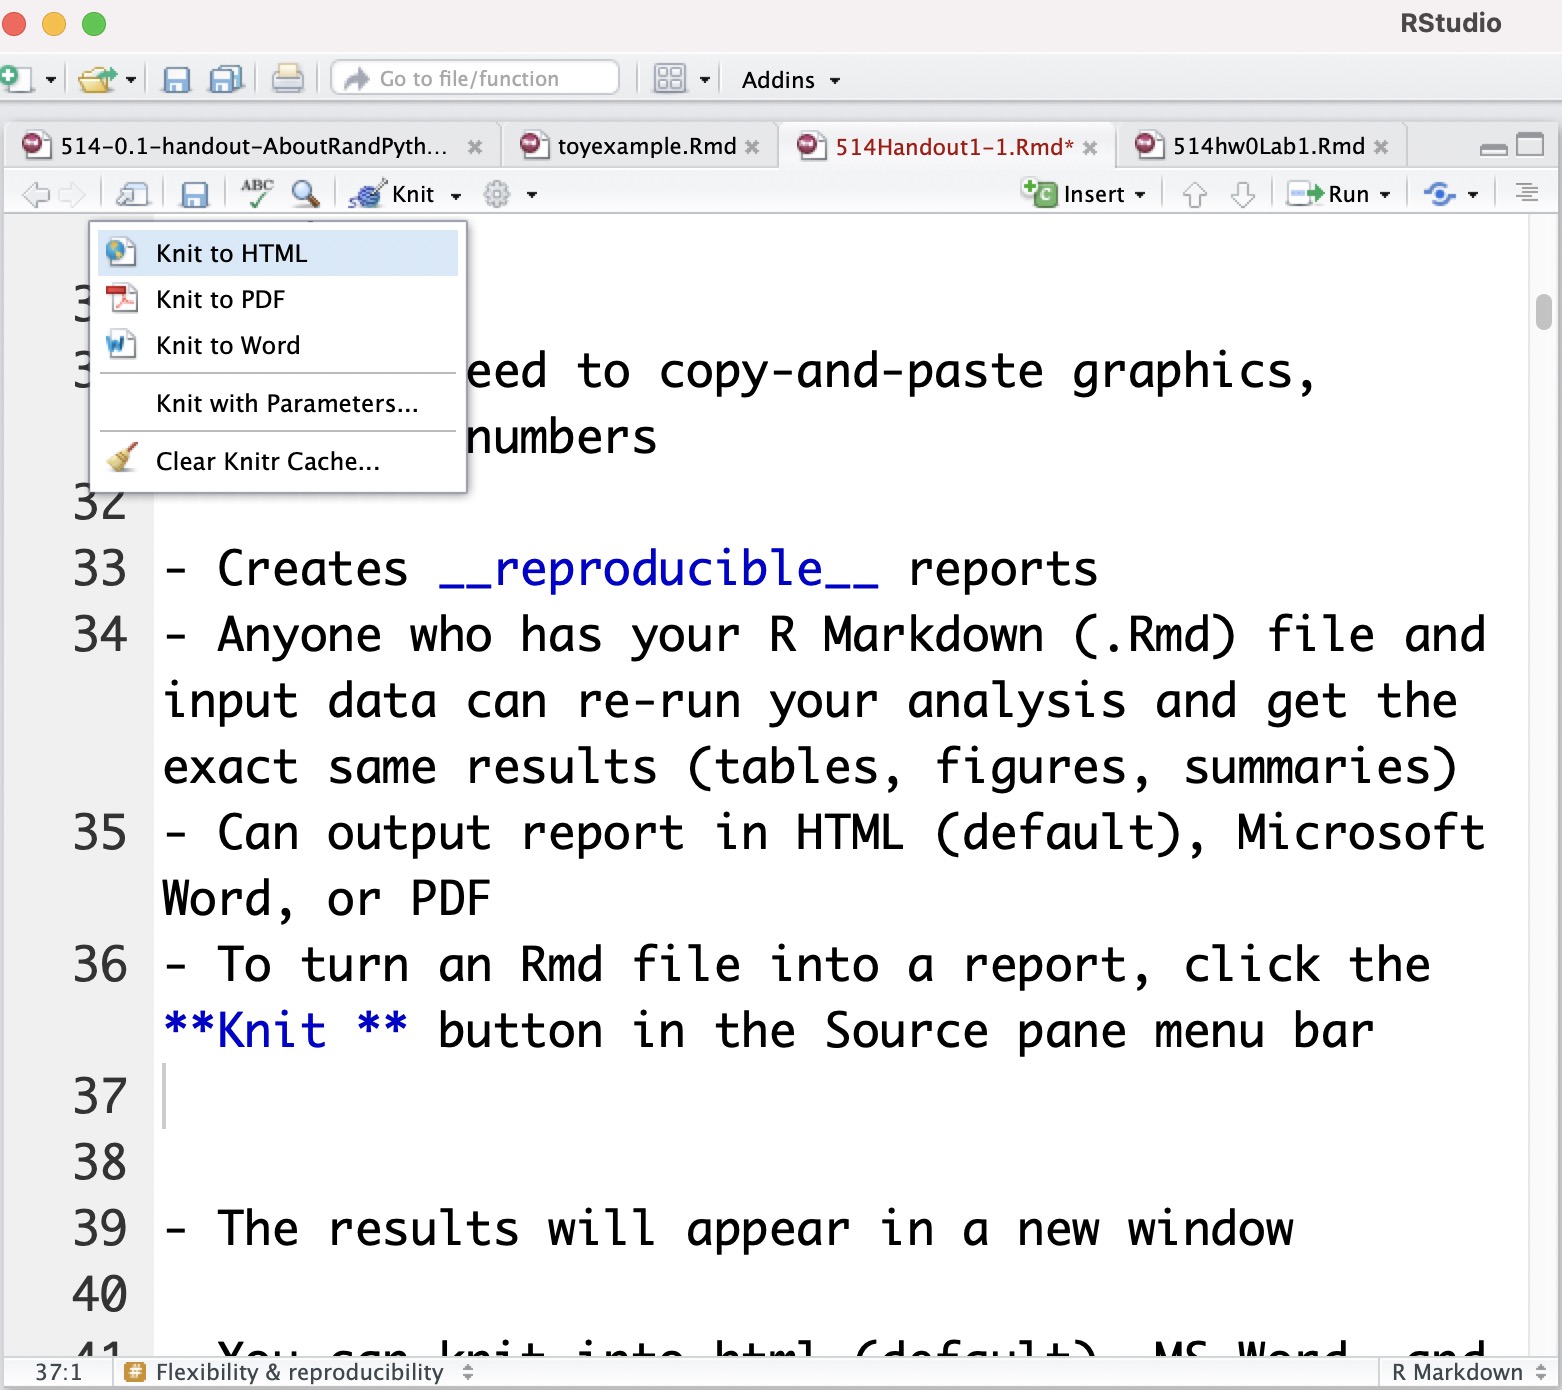
  • Can output report in HTML (default), Microsoft Word, or PDF
    可以以 HTML(默认)、Microsoft Word 或 PDF 格式输出报告
  • To turn an Rmd file into a report, click the Knit button in the Source pane menu bar
    要将 Rmd 文件转换为报告,请单击 “源” 窗格菜单栏中的 “Kint” 按钮
  • The results will appear in a new window
    结果将出现在新窗口中
  • You can knit into html (default), MS Word, and pdf format
    您可以 Kint 成 html(默认)、MS Word 和 pdf 格式
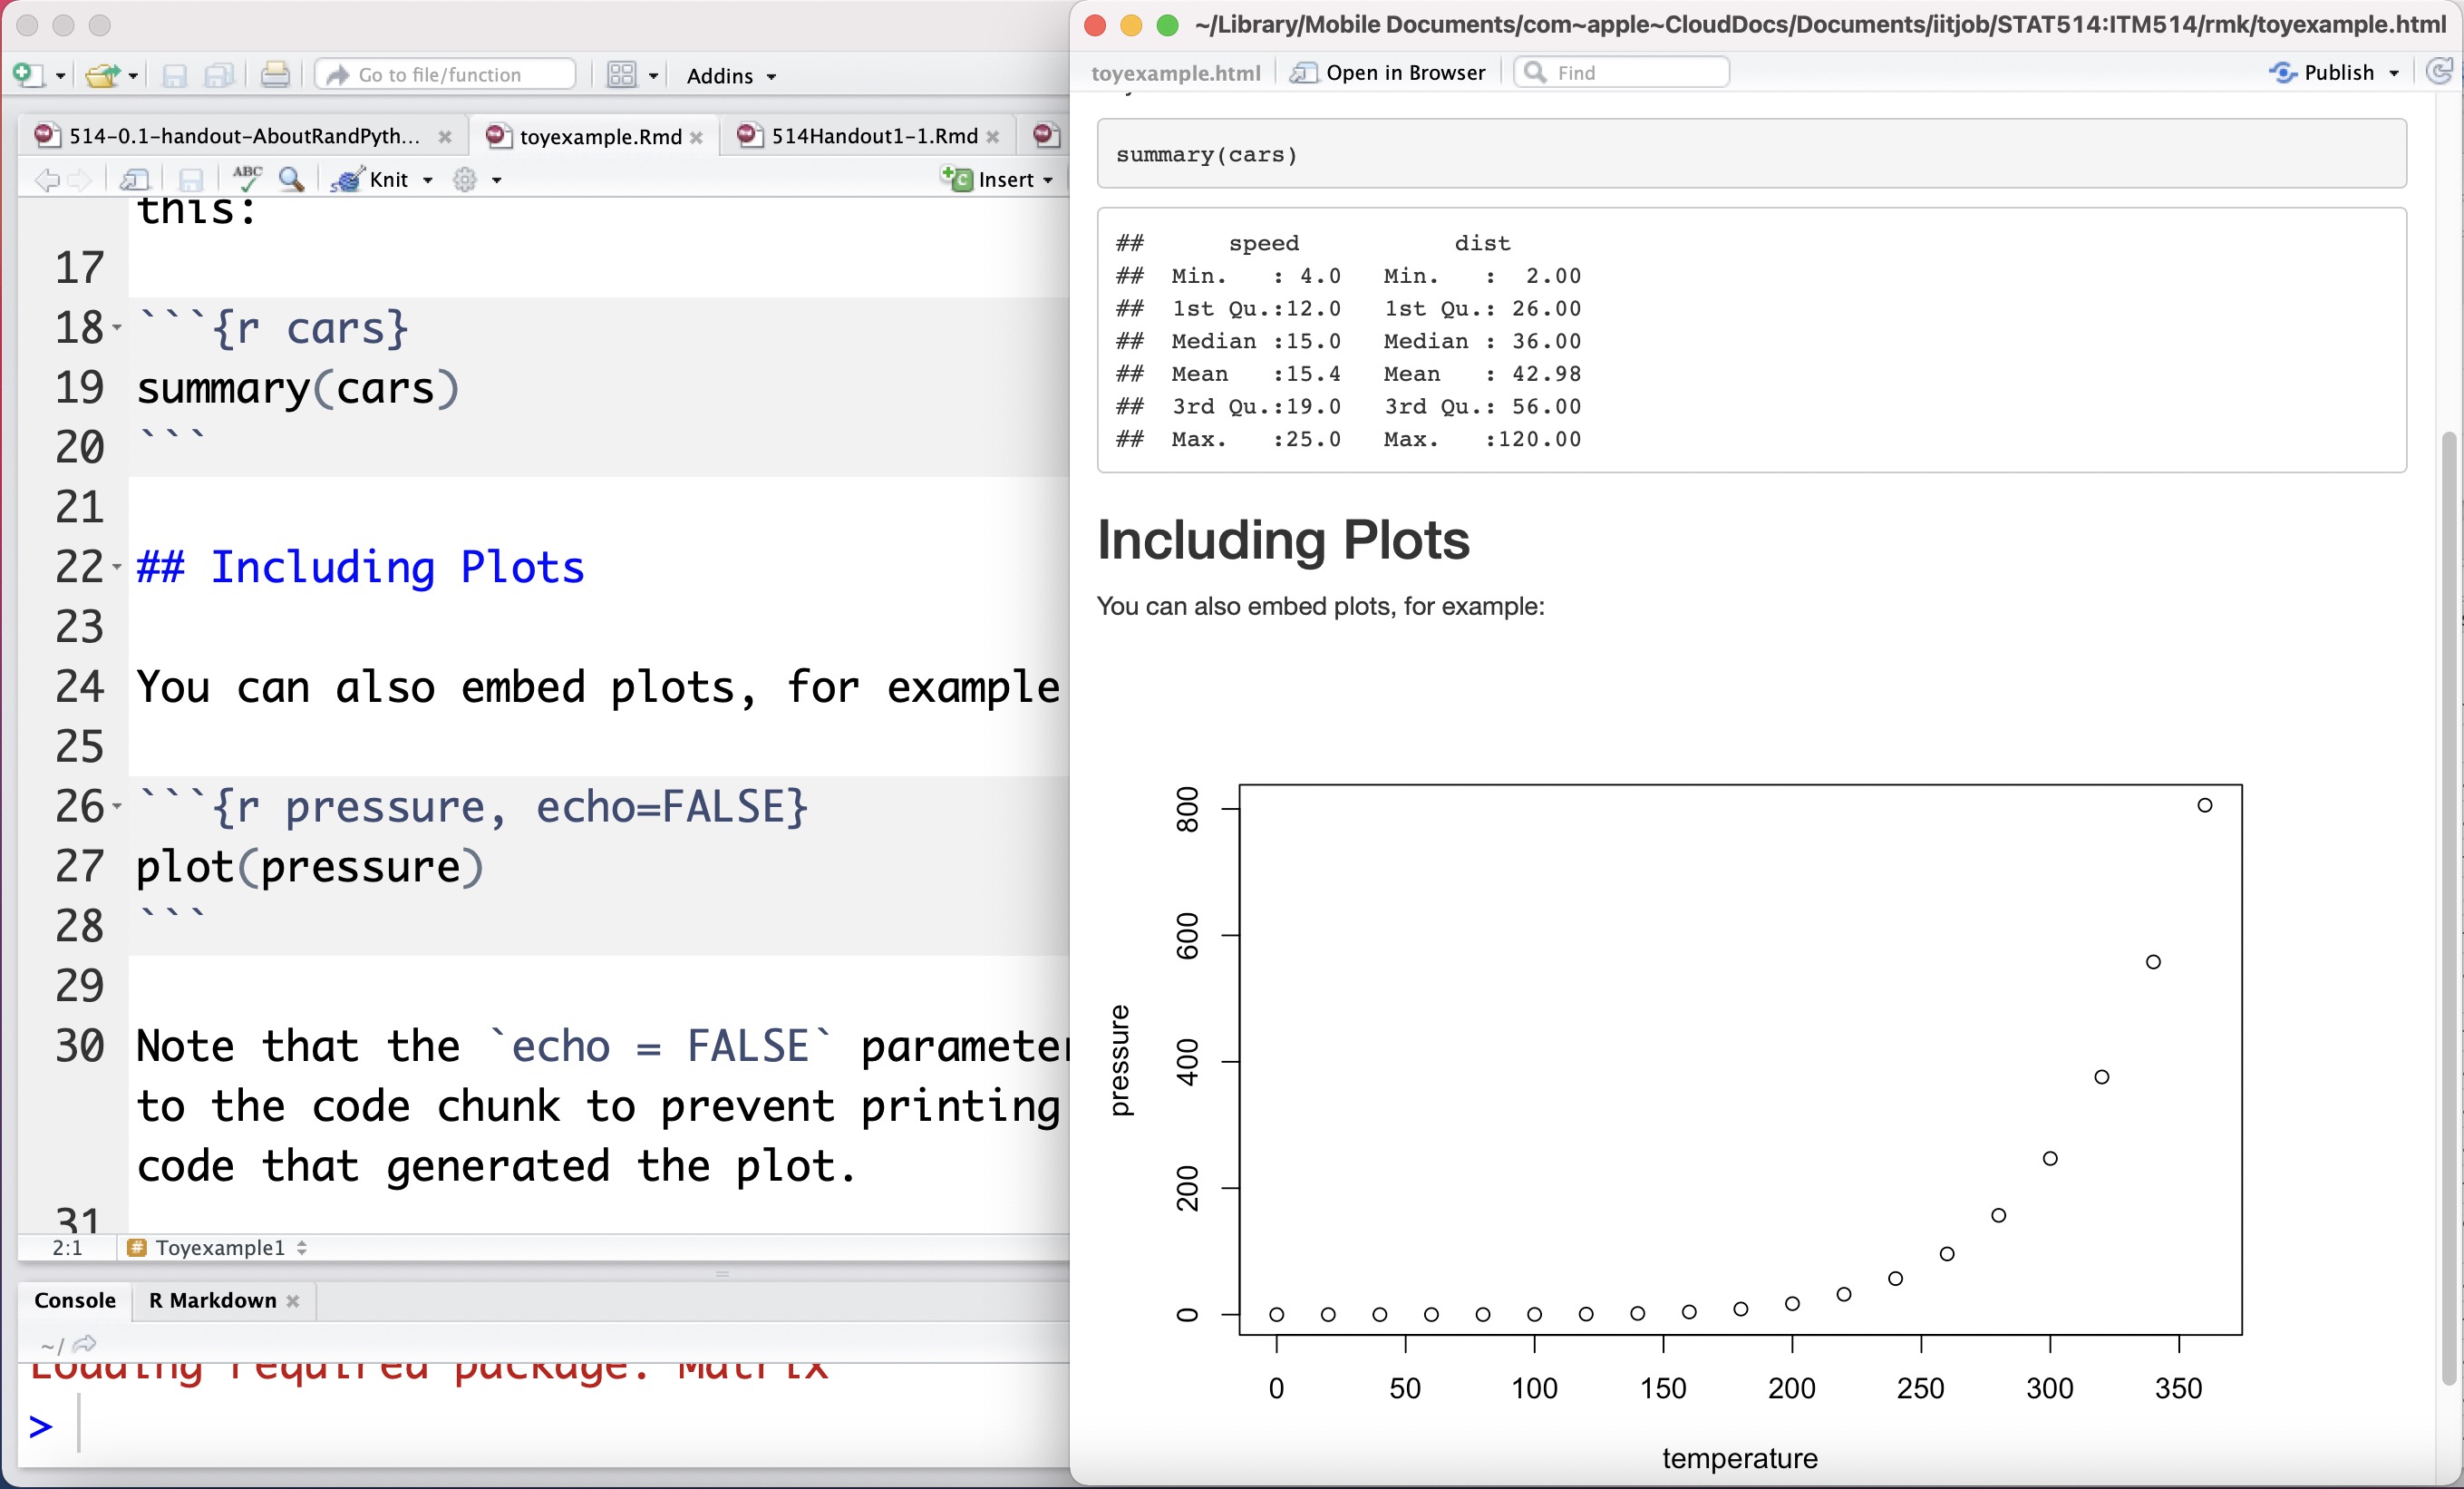
  • To integrate R output into your report, you need to use R code chunks
    要将 R 输出集成到您的报告中,您需要使用 R 代码块
  • All of the code that appears in between the "triple back-ticks" gets executed when you Knit
    出现在 “三重反引号” 之间的所有代码在您编织时都会执行

# R basics

Pro tip: The ideas here apply to Python just as well, but the syntax is slightly different. We will cover those differences in a later lecture.
这些同样适用于 Python,但语法略有不同。我们将在后面的讲座中介绍这些差异。

  • Everything we'll do comes down to applying functions to data
    我们要做的一切都归结为将函数应用于数据
  • Data: things like 7, "seven", 7.0007.000, the matrix

    [777777]\begin{bmatrix} 7 & 7 & 7 \\ 7 & 7 & 7 \\ \end{bmatrix}

  • Functions: things like log\log{}, ++ (two arguments), << (two), mod\mod{} (two), mean (one)

A function is a machine which turns input objects (arguments) into an output object (return value), possibly with side effects, according to a definite rule
函数是一台机器,它根据确定的规则将输入对象(参数)转换为输出对象(返回值),可能有副作用

# Data building blocks 数据构建块

You'll encounter different kinds of data types
你会遇到不同种类的数据类型

  • Booleans Direct binary values: TRUE or FALSE in R
    布尔值
  • Integers: whole numbers (positive, negative or zero)
    整数(正数、负数或零)
  • Characters fixed-length blocks of bits, with special coding;
    字符,固定长度的比特块,有特殊编码
    strings = sequences of characters
    字符串 = 字符序列
  • Floating point numbers: a fraction (with a finite number of bits) times an exponent, like 1.87×1061.87 \times {10}^{6}
    浮点数:分数(具有有限位数)乘以指数
  • Missing or ill-defined values: NA , NaN , etc.
    缺少或不明确的值

# Operators (functions) 运算符(函数)

  • You can use R as a very, very fancy calculator
    你可以将 R 用作一个非常奇特的计算器
CommandDescription
+,-,*,\add, subtract, multiply, divide加、减、乘、除
^raise to the power of加权
%%remainder after division (ex: 8 %% 3 = 2 )除余
( )change the order of operations改变操作顺序
log(), exp()logarithms and exponents (ex: log(10) = 2.302 )对数和指数
sqrt()square root平方根
round()round to the nearest whole number (ex: round(2.3) = 2 )四舍五入为最接近的整数
floor(), ceiling()round down or round up向下舍入或向上舍入
abs()absolute value绝对值
7 + 5 # Addition
[1] 12
7 - 5 # Subtraction
[1] 2
7 * 5 # Multiplication
[1] 35
7 ^ 5 # Exponentiation
[1] 16807
7 / 5 # Division
[1] 1.4
7 %% 5 # Modulus
[1] 2
7 %/% 5 # Integer division
[1] 1
  • Comparisons are also binary operators; they take two objects, like numbers, and give a Boolean
    比较也是二元运算符;他们接受两个对象,比如数字,并给出一个布尔值

    7 > 5
    [1] TRUE
    
    7 < 5
    [1] FALSE
    
    7 >= 7
    [1] TRUE
    
    7 <= 5
    [1] FALSE
    
    7 == 5
    [1] FALSE
    
    7 != 5
    [1] TRUE
    

# Boolean operators 布尔运算符

Basically "and" and "or":
基本上是 “和” 和 “或”:

(5 > 7) & (6*7 == 42)
[1] FALSE
(5 > 7) | (6*7 == 42)
[1] TRUE

will see special doubled forms, && and || , later
稍后将看到特殊的双重形式,&& 和 ||

# More types 更多类型

  • typeof() function returns the type
    返回类型
  • is.foo() functions return Booleans for whether the argument is of type foo
    返回布尔值以确定参数是否为 foo 类型
  • as.foo() (tries to) "cast" its argument to type foo --- to translate it sensibly into a foo-type value
    (尝试)将其参数 “强制转换” 为类型 foo --- 将其合理地转换为 foo 类型值

Special case: as.factor() will be important later for telling R when numbers are actually encodings and not numeric values. (E.g., 1 = High school grad; 2 = College grad; 3 = Postgrad)
as.factor() 在数字实际上是编码而不是数值时很重要。
(例如,1 = 高中毕业生;2 = 大学毕业生;3 = 研究生)

typeof(7)
[1] "double"
is.numeric(7)
[1] TRUE
is.na(7)
[1] FALSE
is.character(7)
[1] FALSE
is.character("7")
[1] TRUE
is.character("seven")
[1] TRUE
is.na("seven")
[1] FALSE

# Variables 变量

  • We can give names to data objects; these give us variables
    我们可以给数据对象命名;这些给了我们变量

  • A few variables are built in:
    有一些内置变量:

    pi
    [1] 3.141593
    
  • Variables can be arguments to functions or operators, just like constants:
    变量可以是函数或运算符的参数,就像常量一样:

    pi*10
    [1] 31.41593
    
    cos(pi)
    [1] -1
    

# Assignment operator 赋值运算符

  • Most variables are created with the assignment operator, <- or =
    大多数变量是使用赋值运算符创建的

    time.factor <- 12
    time.factor
    [1] 12
    
    time.in.years = 2.5
    time.in.years * time.factor
    [1] 30
    
  • The assignment operator also changes values:
    赋值运算符还会更改值:

    time.in.months <- time.in.years * time.factor
    time.in.months
    [1] 30
    
    time.in.months <- 45
    time.in.months
    [1] 45
    
  • Using names and variables makes code: easier to design, easier to debug, less prone to bugs, easier to improve, and easier for others to read
    使用名称和变量使代码:更容易设计,更容易调试,更不容易出错,更容易改进,更容易被其他人阅读

  • Avoid "magic constants"; use named variables
    避免 “魔法常数”;使用命名变量

  • Use descriptive variable names
    使用描述性变量名称

    • Good: num.students <- 35
    • Bad: ns <- 35

# The workspace 工作区

  • What names have you defined values for?
    为哪些名称定义了值?

    ls()
    [1] "time.factor" "time.in.months" "time.in.years" 
    
  • Getting rid of variables:
    移除变量:

    rm("time.in.months")
    ls()
    [1] "time.factor" "time.in.years"
    

# First data structure: vectors 第一个数据结构:向量

  • Group related data values into one object, a data structure
    将相关的数据值组合成一个对象,一种数据结构

  • A vector is a sequence of values, all of the same type
    vector 是所有相同类型的值的序列,

  • c() function returns a vector containing all its arguments in order
    c() 函数返回一个按顺序包含其所有参数的向量

    students <- c("Sean", "Louisa", "Frank", "Farhad", "Li")
    midterm <- c(80, 90, 93, 82, 95)
  • Typing the variable name at the prompt causes it to display
    键入变量名称可显示值

    students
    [1] "Sean" "Louisa" "Frank" "Farhad" "Li"    
    

# Indexing 索引

  • vec[1] is the first element, vec[4] is the 4th element of vec
    vec[1] 是第一个元素, vec[4] 是第四个元素 vec
    students[4]
    [1] "Farhad"
    
  • vec[-4] is a vector containing all but the fourth element
    vec[-4] 是一个包含除第四个元素之外的所有元素的向量
    students[-4]
    [1] "Sean" "Louisa" "Frank" "Li"    
    

# Vector arithmetic 向量算术

Operators apply to vectors "pairwise" or "elementwise":
运算符适用于向量 “成对” 或 “元素”:

final <- c(78, 84, 95, 82, 91) # Final exam scores
midterm # Midterm exam scores
[1] 80 90 93 82 95
midterm + final # Sum of midterm and final scores
[1] 158 174 188 164 186
(midterm + final)/2 # Average exam score
[1] 79 87 94 82 93
course.grades <- 0.4*midterm + 0.6*final # Final course grade
course.grades
[1] 78.8 86.4 94.2 82.0 92.6

# Pairwise comparisons 成对比较

  • Is the final score higher than the midterm score?
    期末成绩比期中成绩高吗?

    midterm
    [1] 80 90 93 82 95
    
    final
    [1] 78 84 95 82 91
    
    final > midterm
    [1] FALSE FALSE TRUE FALSE FALSE
    
  • Boolean operators can be applied elementwise:
    布尔运算符可以按元素应用:

    (final < midterm) & (midterm > 80)
    [1] FALSE TRUE FALSE FALSE TRUE
    

# Functions on vectors 向量相关的函数

CommandDescription
sum(vec)sums up all the elements of vec所有的元素之和
mean(vec)mean of vec平均值
median(vec)median of vec中位数
min(vec), max(vec)the largest or smallest element of vec最大或最小的元素
sd(vec), var(vec)the standard deviation and variance of vec标准差和方差
length(vec)the number of elements in vec元素数量
pmax(vec1, vec2), pmin(vec1, vec2)example: pmax(quiz1, quiz2) returns the higher of quiz 1 and quiz 2 for each student示例: pmax(quiz1, quiz2) 为每个学生返回测验 1 和测验 2 中较高的一个
sort(vec)returns the vec in sorted order返回排序后的向量
order(vec)returns the index that sorts the vector vec返回排序后的索引
unique(vec)lists the unique elements of vec列出的唯一元素
summary(vec)gives a five-number summary给出五位数总结
any(vec), all(vec)useful on Boolean vectors对布尔向量有用
course.grades
[1] 78.8 86.4 94.2 82.0 92.6
mean(course.grades) # mean grade
[1] 86.8
median(course.grades)
[1] 86.4
sd(course.grades) # grade standard deviation
[1] 6.625708
sort(course.grades)
[1] 78.8 82.0 86.4 92.6 94.2
max(course.grades) # highest course grade
[1] 94.2
min(course.grades) # lowest course grade
[1] 78.8

# Referencing elements of vectors 引用向量中的元素

students
[1] "Sean" "Louisa" "Frank" "Farhad" "Li"
  • Vector of indices:
    索引向量:

    students[c(2,4)]
    [1] "Louisa" "Farhad"
    
  • Vector of negative indices
    负指数向量

    students[c(-1,-3)]
    [1] "Louisa" "Farhad" "Li" 
    
  • which() returns the TRUE indexes of a Boolean vector:

    course.grades
    [1] 78.8 86.4 94.2 82.0 92.6
    
    a.threshold <- 90 # A grade = 90% or higher
    course.grades >= a.threshold # vector of booleans
    [1] FALSE FALSE TRUE FALSE TRUE
    
    a.students <- which(course.grades >= a.threshold) # Applying which() 
    a.students
    [1] 3 5
    
    students[a.students] # Names of A students
    [1] "Frank" "Li" 
    

# Named components 命名组件

You can give names to elements or components of vectors
您可以为向量的元素或组件命名

students
[1] "Sean" "Louisa" "Frank" "Farhad" "Li"    
names(course.grades) <- students # Assign names to the grades
names(course.grades)
[1] "Sean" "Louisa" "Frank" "Farhad" "Li"
course.grades[c("Sean", "Frank", "Li")] # Get final grades for 3 students
Sean Frank    Li 
78.8  94.2  92.6 

Note the labels in what R prints; these are not actually part of the value
注意 R 打印的标签;这些实际上不是值的一部分

# Matrix

# vector 转 matirx

height <- c(188,187,193,168,173,176)
height
[1] 188 187 193 168 173 176
heightMatrix <- matrix(height, nrow=2)
heightMatrix
    [,1] [,2] [,3]
[1,]  188  193  173
[2,]  187  168  176

# 计算均值

mean(heightMatrix)
[1] 180.8333
colMeans(heightMatrix)
[1] 187.5 180.5 174.5
rowMeans(heightMatrix)
[1] 184.6667 177.0000

# 计算方差

var(heightMatrix)
    [,1]  [,2]  [,3]
[1,]  0.5  12.5  -1.5
[2,] 12.5 312.5 -37.5
[3,] -1.5 -37.5   4.5

协方差矩阵。 This is a covariance matrix.

# 取值

heightMatrix[2,3]
[1] 176
heightMatrix[2,]
[1] 187 168 176

# 赋值

heightMatrix[2,3]<-1766
heightMatrix
    [,1] [,2] [,3]
[1,]  188  193  173
[2,]  187  168 1766

# Useful RStudio tips 有用的 RStudio tips

KeystrokeDescription
<tab>autocompletes commands and filenames, and lists arguments for functions. Highly useful!自动完成命令和文件名,并列出函数的参数。非常有用!
<up>cycle through previous commands in the console prompt在控制台提示中循环执行先前的命令
<ctrl-up>lists history of previous commands matching an unfinished one列出与未完成命令匹配的先前命令的历史记录
<ctrl-enter>paste current line from source window to console. Good for trying things out ideas from a source file.将当前行从源窗口粘贴到控制台。非常适合从源文件中尝试想法。
<ESC>as mentioned, abort an unfinished command and get out of the + prompt如前所述,中止未完成的命令并退出 + 提示符

# Installing and loading packages 安装和加载包

Just like every other programming language you may be familiar with, R's capabilities can be greatly extended by installing additional "packages" and "libraries".
就像你可能熟悉的所有其他编程语言一样,R 的功能可以通过安装额外的 “包” 和 “库” 得到极大的扩展。

To install a package, use the install.packages() command. You'll want to run the following commands to get the necessary packages for today's lab:
安装软件包,请使用该 install.packages() 命令。您需要运行以下命令来获取今天 lab 所需的包:

install.packages("rmdformats")
install.packages("ggplot2")
install.packages("knitr")

You only need to install packages once. Once they're installed, you may use them by loading the libraries using the library() command. For today's lab, you'll want to run the following code
您只需要安装一次软件包。安装后,可以通过使用 library() 命令加载库来使用它们。对于今天的 lab,您需要运行以下代码

library(ggplot2) # graphics library
library(knitr)   # contains kable() function
options(scipen = 4)  # Suppresses scientific notation

# In-class exercise 课堂练习

# Hello world!

  1. Open RStudio on your machine
  2. File > New File > R Markdown ...
  3. Change summary(cars) in the first code block to print("Hello world!")
  4. Click Knit HTML to produce an HTML file.
  5. Save your Rmd file as helloworld.Rmd