# Unsupervised learning 无监督学习
Unsupervised learning is the machine learning task of inferring a function to describe hidden structure from unlabeled data.
无监督学习是从未标记的数据中推断出描述隐藏结构的函数的机器学习任务。
Since the examples given to the learner are unlabeled, there is no error or reward signal to evaluate a potential solution.
因为给学习者的例子是未标记的,所以没有错误或奖励信号来评估潜在的解决方案。
This distinguishes unsupervised learning from supervised learning and reinforcement learning.
这将无监督学习与监督学习和强化学习区分开来。
# Approaches related to unsupervised learning 与无监督学习相关的方法
- Clustering
- Association Rule Mining
- Principal Component Analysis
- etc...
# How to evaluate unsupervised learning 如何评价无监督学习
- Usually, we do not have a metric for evaluations
通常没有评估的标准 - But there are two ways 但是有两种方法
- We can manually look at the outputs, analyze and interpret it, to see whether there are significant differences and they are useful
可以手动查看输出,对其进行分析和解释,以查看是否存在显著差异以及它们是否有用 - The outputs of unsupervised learning can be used as inputs to a supervised learning process, to see whether the supervised learning can be improved
非监督学习的输出可以用作监督学习过程的输入,以查看是否可以改进监督学习
- We can manually look at the outputs, analyze and interpret it, to see whether there are significant differences and they are useful
# Clustering 聚类
「机器学习实战」摘录 - 聚类
聚类是一种无监督的学习,它将相似的对象归到同一个簇中。
它有点像全自动分类。
聚类方法几乎可以应用于所有对象,簇内的对象越相似,聚类的效果越好。
簇识别(cluster identification)给出聚类结果的含义。
假定有一些数据,现在将相似数据归到一起,簇识别会告诉我们这些簇到底都是些什么。
聚类与分类的最大不同在于,分类的目标事先已知,而聚类则不一样。
因为其产生的结果与分类相同,而只是类别没有预先定义,聚类有时也被称为无监督分类(unsupervised classification)。
聚类分析试图将相似对象归入同一簇,将不相似对象归到不同簇。
相似这一概念取决于所选择的相似度计算方法。
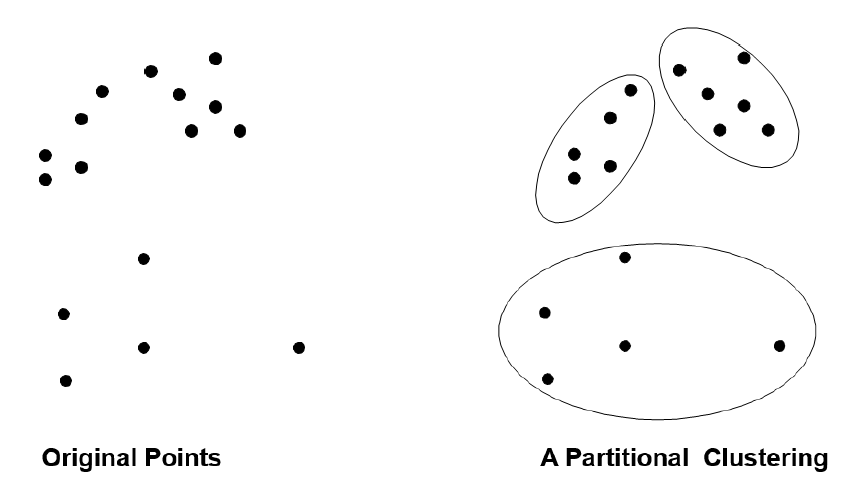
- Partitional Clustering 分区聚类
- just group objects to minimize intra cluster distances and maximize inter cluster distances
只对对象进行分组,以最小化簇内距离和最大化簇间距离
Example: Document Clustering
示例:文档聚类![]()
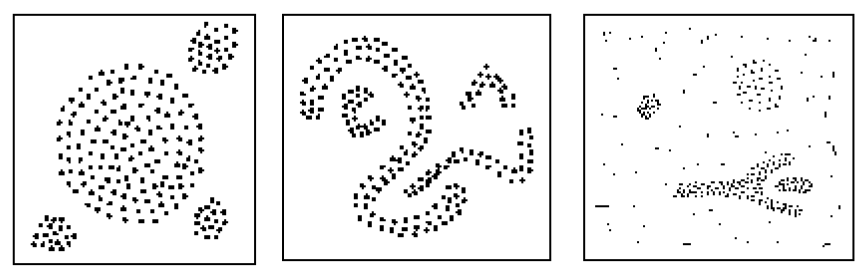
- Density Based Clustering 基于密度的聚类
- cluster objects based on the local connectivity and density functions
基于局部连通性和密度函数对对象进行聚类
Each cluster has a considerable higher density of points than outside of the cluster
每个簇都具有比簇外部高得多的点密度![]()
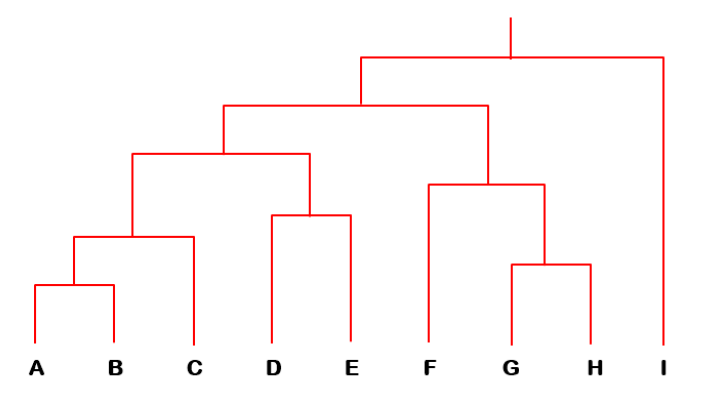
- Hierarchical Clustering 分层聚类
- a clustering process in order to discover the hierarchical structure, like a hierarchical tree
一个聚类过程,以发现分层结构,如分层树
Example: categories and subcategories; taxonomies
示例:类别和子类别;分类学![]()
# Partitional Clustering 分区聚类
- Partitional Clustering
- a unsupervised way to group objects
一种无监督的对象分组方法
Goal:
Finding groups of objects in data such that the objects in a group will be similar (or related) to one another and different from (or unrelated to) the objects in other groups
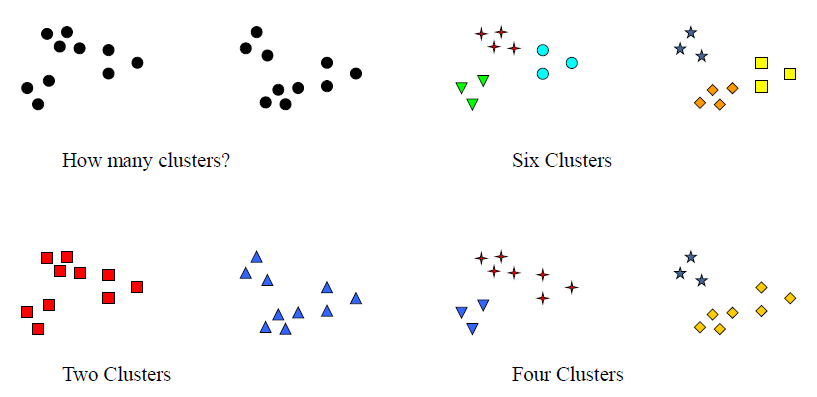
在数据中寻找对象组,使得一个组中的对象彼此相似 (或相关),而与其他组中的对象不同 (或无关)Notion of a Cluster can be Ambiguous
簇的概念可能是模糊的![]()
Basic idea
- Measure similarity or distance between each two objects
测量每两个对象之间的相似性或距离 - Group the objects based on these similartiies
根据这些相似性对对象进行分组
- Measure similarity or distance between each two objects

- Distance or Similarity Measures 距离或相似性度量
Common Distance Measures:
常见的距离度量方法Manhattan distance:
Euclidean distance:
Cosine distance:
# K-Means Clustering Algorithm K - 均值聚类算法
「机器学习实战」摘录 - K-均值聚类算法
之所以称之为 K - 均值是因为它可以发现 个不同的簇,且每个簇的中心采用簇中所含值的均值计算而成。
K - 均值是发现给定数据集的 个簇的算法。
簇个数 是用户给定的,每一个簇通过其质心 centroid ,即簇中所有点的中心来描述。
- 优点:容易实现。
- 缺点:可能收敛到局部最小值,在大规模数据集上收敛较慢。
- 适用数据类型:数值型数据。
Assume we have many examples/instances, each example can be represented by a vector of features, where the features must be numerical ones, e.g., weight, size, price, profits, etc
假设我们有许多例子 / 实例,每个例子可以由特征向量表示,其中特征必须是数字的,例如重量、尺寸、价格、利润等So that, we can use the distance measures to calculate the similarity or the dissimilarity (i.e., distance) between each two examples.
因此,我们可以使用距离度量来计算每两个示例之间的相似性或不相似性 (即,距离)。With such setting, we are able to apply a K-Means clustering algorithms to perform the normal clustering task.
通过这样的设置,我们能够应用 K-Means 聚类算法来执行正常的聚类任务。
# Steps

- Init: initialize K and K clusters
初始化 K 和 K 个簇
There are multiple ways to define the initial cluster:
定义初始簇有多种方式:- You can randomly choose K instances and each one of them is an individual cluster;
可以随机选择 K 个实例,每个实例都是一个独立的簇; - Or, you can randomly assign all or parts of your instances into K groups.
或者,可以将所有或部分实例随机分配到 K 个组中。
Each group is an individual cluster.
每个组都是一个单独的簇。
- You can randomly choose K instances and each one of them is an individual cluster;
- Step 1. Calculate centroids for K clusters
计算 K 个簇的质心 - Step 2. Assign data points to each cluster based on the distance between data and centroids
根据数据点和质心之间的距离,将数据点分配给每个簇 - Step 3. get new K clusters, compare them with previous clusters
获得 K 个新的簇,将它们与先前的簇进行比较 - Step 4. Repeat 1,2,3 until convergence (i.e., no points move between clusters)
重复 1、2、3 直到收敛 (即没有点在簇之间移动)
「机器学习实战」摘录 - K-均值算法的工作流程
首先,随机确定 个初始点作为质心。
然后将数据集中的每个点分配到一个簇中,具体来讲,为每个点找距其最近的质心,并将其分配给该质心所对应的簇。
这一步完成之后,每个簇的质心更新为该簇所有点的平均值。
上述过程的伪代码表示如下:
创建k个点作为起始质心(经常是随机选择)
当任意一个点的簇分配结果发生改变时
    对数据集中的每个数据点
        对每个质心
            计算质心与数据点之间的距离
        将数据点分配到距其最近的簇
    对每一个簇,计算簇中所有点的均值并将均值作为质心
上面提到 “最近” 质心的说法,意味着需要进行某种距离计算。
可以使用所喜欢的任意距离度量方法。
# Stopping Criterion in Iterative learning 迭代学习中的停止准则
- We need to stop the learning iterations when it is converged
收敛时需要停止学习迭代 - How to determine it is converged?
如何确定它是收敛的?- Criterion 1: new clusters = old clusters
准则 1: 新簇 = 旧簇
stop learning when no changes on clusters
当簇没有变化时停止学习 - Criterion 2: setup a maximal learning iterations
准则 2: 设置最大的学习迭代次数
stop learning when it got to maximal learning iterations
当它达到最大的学习迭代次数时,停止学习 - In practice, we usually use 2nd criterion, since clustering may converge after several/unexpected iterations, especially when the data set is large
在实践中,我们通常使用第二准则,因为聚类可能会在几次 / 意想不到的迭代后收敛,特别是当数据集很大的时候
- Criterion 1: new clusters = old clusters

# Example
有 8 个文档 document (D1-D8),每个文档都由一个项 term 矩阵(T1-T5)表示,数值表示某个 term 出现的次数
| T1 | T2 | T3 | T4 | T5 | |
|---|---|---|---|---|---|
| D1 | 0 | 3 | 3 | 0 | 2 |
| D2 | 4 | 1 | 0 | 1 | 2 |
| D3 | 0 | 4 | 0 | 0 | 2 |
| D4 | 0 | 3 | 0 | 3 | 3 |
| D5 | 0 | 1 | 3 | 0 | 1 |
| D6 | 2 | 2 | 0 | 0 | 4 |
| D7 | 1 | 0 | 3 | 2 | 0 |
| D8 | 3 | 1 | 0 | 0 | 2 |
Init: initialize K and K clusters
- 拟创建 3 个组,即 set K=3,但不代表簇个数 K = 3 是最好的,还需要尝试不同的方法
- create initial clusters 创建初始簇
完全随机的,把样本分成三组(C1-C3)Initial (arbitrary) assignment: C1 = {D1,D2}, C2 = {D3,D4}, C3 = {D5,D6}
Step 1. Calculate centroids for K clusters
计算 K 个簇的质心算每一列的均值,即簇中所有点的中心,即质心
centroid。T1 T2 T3 T4 T5 D1 0 3 3 0 2 D2 4 1 0 1 2 D3 0 4 0 0 2 D4 0 3 0 3 3 D5 0 1 3 0 1 D6 2 2 0 0 4 D7 1 0 3 2 0 D8 3 1 0 0 2 C1 4/2 4/2 3/2 1/2 4/2 C2 0/2 7/2 0/2 3/2 5/2 C3 2/2 3/2 3/2 0/2 5/2 Step 2. Assign data points to each cluster based on the distance between data and centroids
根据数据点和质心之间的距离,将数据点分配给每个簇Now compute the similarity (or distance) of each item with each cluster, resulting a cluster-document similarity matrix.
现在计算每个 item 与每个簇的相似性 (或距离),得到一个聚类 - 文档相似性矩阵
Here we use dot product as the similarity measure for simplicity
为了简单起见,这里使用点积作为相似性度量。计算质心与各个数据点之间的距离
如果使用距离,需要将数据点放入距离最小的聚类
如果使用相似性,需要将数据点放入具有最大相似性的聚类。
本例使用了相似性来度量dot product & Cosine similarity
Recall that the Cosine similarity of two vectors is their dot product divided by the product of their norms.
回想一下,两个向量的余弦相似度是它们的点积除以它们的范数的乘积。For example, Consider the two vectors and :
The dot product is given by sum of the coordinate-wise multiples:
\begin{align} \operatorname{dot-product}(X, Y) & = 3 \times 2+0 \times 0+1 \times 0+2 \times 3+0 \times 8+3 \times 4 \\ & = 6+0+0+6+0+12 \\ & = 24 \end{align}
点积由坐标倍数的总和给出:The norm of each vector is the square-root of the sum of the squares of its dimension values.
每个向量的范数是其尺寸值平方和的平方根。
So, the norms of X and Y are:
所以,X 和 Y 的范数是:and the Cosine similarity of X and Y is given by:
X 和 Y 的余弦相似性由下式给出:D1 D2 D3 D4 D5 D6 D7 D8 C1 29/2 29/2 24/2 27/2 17/2 32/2 15/2 24/2 C2 31/2 20/2 38/2 45/2 12/2 34/2 6/2 17/2 C3 28/2 21/2 22/2 24/2 17/2 30/2 11/2 19/2 For each document, reallocate the document to the cluster to which it has the highest similarity (shown in red in the above table).
对于每个文档,将该文档重新分配到与其具有最高相似性的簇中 (在上表中以红色显示)。
After the reallocation we have the following new clusters.
重新分配后,我们有以下新的簇。New assignment: C1 = {D2,D7,D8}, C2 = {D1,D3,D4,D6}, C3 = {D5}Note that the previously unassigned D7 and D8 have been assigned, and that D1 and D6 have been reallocated from their original assignment.
请注意,之前未分配的 D7 和 D8 已被分配,D1 和 D6 已从其原始分配中重新分配。This is the end of first iteration (i.e., the first reallocation).
这是第一次迭代 (即第一次重新分配) 的结束。Next, we repeat the process for another reallocation…
接下来,我们重复该过程进行另一次重新分配…Step 3. get new K clusters, compare them with previous clusters
获得 K 个新的簇,将它们与先前的簇进行比较Now compute new cluster centroids using the original document-term matrix
现在使用原始的文档 - 项矩阵计算新的簇质心T1 T2 T3 T4 T5 D1 0 3 3 0 2 D2 4 1 0 1 2 D3 0 4 0 0 2 D4 0 3 0 3 3 D5 0 1 3 0 1 D6 2 2 0 0 4 D7 1 0 3 2 0 D8 3 1 0 0 2 C1 8/3 2/3 3/3 3/3 4/3 C2 2/4 12/4 3/4 3/4 11/4 C3 0/1 1/1 3/1 0/1 1/1 This will lead to a new cluster-doc similarity matrix similar to previous slide.
这将产生一个新的簇 - 文档相似性矩阵,与前类似。D1 D2 D3 D4 D5 D6 D7 D8 C1 7.67 15.01 5.34 9.00 5.00 12.00 7.67 11.34 C2 16.75 11.25 17.50 19.50 8.00 6.68 4.25 10.00 C3 14.00 3.00 6.00 6.00 11.00 9.34 9.00 3.00 Again, the items are reallocated to clusters with highest similarity.
同样,文档被重新分配到具有最高相似性的簇中。New assignment: C1 = {D2,D6,D8}, C2 = {D1,D3,D4}, C3 = {D5,D7}
Note: This process is now repeated with new clusters.
注意:现在对新的簇重复这一过程。
However, the next iteration in this example will show no change to the clusters, thus terminating the algorithm.
然而,本例中的下一次迭代将不会有簇的变化,从而终止该算法。
# Evaluations 评价
There are no clear evaluations:
没有明确的评价:
clustering is good as long asit can serve for your usage or applications
只要能为您的使用或应用服务,聚类就是好的Most common measure is Sum of Squared Error
SSE
最常见的衡量标准是误差平方和SSEFor each point, the error is the distance to the nearest cluster
对于每个点,误差是到最近簇的距离To get
SSE, we square these errors and sum them.
为了得到SSE,我们将这些误差平方并求和。It is not a metric to evaluate clustering results
它不是评估聚类结果的指标is a data point in cluster and is the representative point for cluster
是簇 中的数据点,而 是簇 的代表点
can show that micorresponds to the center (mean) of the cluster
可以显示对应于簇中心 (平均值) 的微反应Drawback: if K is increased,
SSEcan be decreased
缺点:如果 K 增加,SSE可以减少It is used to measure how well the clustering process isIt cannot tell how well the clustering results are
它用于衡量聚类过程在多大程度上无法判断聚类结果的好坏SSEcan also be used to find the best K value
还可用于查找最佳 K 值
Try K = 3, 5, 7, 10, 13, 20, etc…
Observe the K value which can lower SSE
「机器学习实战」摘录 - 度量聚类效果 SSE
K - 均值算法收敛但聚类效果较差的原因是,K - 均值算法收敛到了局部最小值,而非全局最小值(局部最小值指结果还可以但并非最好结果,全局最小值是可能的最好结果)。
在包含簇分配结果的矩阵中保存着每个点的误差,即该点到簇质心的距离平方值。
一种用于度量聚类效果的指标是 SSE(Sum of Squared Error,误差平方和)。
SSE 值越小表示数据点越接近于它们的质心,聚类效果也越好。
因为对误差取了平方,因此更加重视那些远离中心的点。
一种肯定可以降低 SSE 值的方法是增加簇的个数,但这违背了聚类的目标。
聚类的目标是在保持簇数目不变的情况下提高簇的质量。
# How to evaluate the clustering results?
- Solution 1
- compare clusters by using centroid and tell the significant differences among different clusters, to better understand why they were put together
通过使用质心来比较簇,并指出不同簇之间的显著差异,以更好地理解为什么将它们放在一起
| Centroid | Gender | GPA | Study Hours | Course Completed |
|---|---|---|---|---|
| C1 | 1 | 2.5 | 20 | 10 |
| C2 | 0.6 | 4.0 | 40 | 3 |
| C3 | 0 | 3.0 | 25 | 11 |
- Solution 2
- add the clustering results into a supervised learning process to learn whether they are able to improve supervised learning
将聚类结果添加到监督学习过程中,以了解它们是否能够改进监督学习
| Student | Gender | GPA | Study Hours | Course Completed | TA? |
|---|---|---|---|---|---|
| S1 | 1 | 2.5 | 20 | 10 | N |
| S2 | 0 | 4.0 | 40 | 3 | Y |
| S3 | 0 | 3.0 | 25 | 11 | Y |
| Student | Gender | GPA | Study Hours | Course Completed | TA? | Cluster |
|---|---|---|---|---|---|---|
| S1 | 1 | 2.5 | 20 | 10 | N | c1 |
| S2 | 0 | 4.0 | 40 | 3 | Y | c2 |
| S3 | 0 | 3.0 | 25 | 11 | Y | c2 |
# Pros and Cons
- Strength of the K-means K 均值的强处
- Relatively efficient: , where is # of objects, is # of clusters, and is # of iterations.
Normally,
相对高效 - Often terminates at a local optimum
经常终止于局部最优
- Relatively efficient: , where is # of objects, is # of clusters, and is # of iterations.
- Weakness of the K-means K - 均值的弱处
- What about categorical data? 分类数据呢
- Performance is sensitive to initializations, e.g., K, initial clusters, and the definition of centriods
性能对初始化的值很敏感,例如 K、初始簇和质心的定义 - Need to specify K, the number of clusters, in advance
需要提前指定 K,也就是簇的数量 - Unable to handle noisy data and outliers
无法处理嘈杂的数据和异常值
- Variations of K-Means usually differ in: K - 均值的变化通常由于以下的不同
- Selection of the initial K Means
初始 K 均值的选择 - Dissimilarity calculations
相异度计算 - Strategies to calculate cluster means
计算簇平均值的策略
- Selection of the initial K Means
# Improve Your Clustering
「机器学习实战」摘录 - 对聚类结果进行改进
那么如何对结果进行改进?你可以对生成的簇进行后处理,一种方法是将具有最大 SSE 值的簇划分成两个簇。
具体实现时可以将最大簇包含的点过滤出来并在这些点上运行 K - 均值算法,其中的 k 设为 2。
有两种可以量化的办法:合并最近的质心,或者合并两个使得 SSE 增幅最小的质心。
第一种思路通过计算所有质心之间的距离,然后合并距离最近的两个点来实现。
第二种方法需要合并两个簇然后计算总 SSE 值。
必须在所有可能的两个簇上重复上述处理过程,直到找到合并最佳的两个簇为止。
# Pre-processing 预处理
- Normalize the data 标准化数据
- Eliminate outliers 消除异常值
# Post-processing 后处理
- Eliminate small clusters that may represent outliers
消除可能代表异常值的小簇 - Split 'loose' clusters, i.e., clusters with relatively high SSE
分割 “松散” 簇,即具有相对较高 SSE 的簇 - Merge clusters that are ‘close’ and that have relatively low SSE
合并 “接近” 且 SSE 相对较低的簇
# Variations of K-Means Clustering K - 均值聚类的变异
- K-Means Clustering: centroid is defined as means
k - 均值聚类:质心被定义为均值 - K-Median Clustering: centroid is defined as medians
k - 中位数聚类:质心被定义为中位数 - K-Medoids Clustering: medoids as centroid
K - 中心点聚类:以中心点为质心 - X-Means Clustering: figure out a way to find best K
X - 均值聚类:找出找到最佳 K 的方法 - Fuzzy C-Means Clustering: fuzzy degree as confidence
模糊 C 均值聚类:模糊度作为置信度 - Many more…
# K-Medoids Clustering
- K-Medoids Clustering
- is built as one of partitonal clustering approaches
它是作为一种分区聚类方法建立的
Medoids as centroids
以中心点为质心 - A medoid
- is defined as the object of a cluster whose average dissimilarity to all the objects in the cluster is minimal.
medoid 被定义为一个簇的对象,其与该簇中所有对象的平均相异度是最小的
In other words, a medoid is the most centrally located points in the cluster.
换句话说,一个 medoid 是簇中位于最中心的点
PAM (Kaufman and Rousseeuw , 1987), built in Splus
Use real object to represent the cluster
- Select representative objects arbitrarily
任意选择 个代表对象 - For each pair of non selected object and selected object , calculate the total swapping cost
对于每对非选定对象 和选定对象,计算总交换成本TC_ - For each pair of and ,
- If , is replaced by
- Then assign each non-selected object to the most similar representative object
- repeat steps 2-3 until there is no change
- Select representative objects arbitrarily
Pros and Cons 利弊
- The centroid is defined as the medoid which is the most centrally located object in one cluster
质心被定义为中心点,也就是簇中位于最中心的对象 - To some extent, it helps alleviate the situation of outliers
在某种程度上,它有助于缓解离群值的情况 - But this approach is not scalable time consuming for large scale of the data set
但是这种方法对于大规模的数据集来说是不可扩展的、耗时的 - Still sensitive to K, initialization, etc
仍然对 K 值、初始化等敏感
- The centroid is defined as the medoid which is the most centrally located object in one cluster
# Density-Based Clustering
Major features: 主要特点
- Discover clusters of arbitrary shape
发现任意形状的簇 - Handle noise
处理噪声
- Discover clusters of arbitrary shape
Several interesting studies:
- DBSCAN: Ester, et al. (KDD’96)
- GDBSCAN: Sander, et al. (KDD’98)
- OPTICS: Ankerst, et al (SIGMOD’99).
- DENCLUE: Hinneburg& D. Keim(KDD’98)
- CLIQUE: Agrawal, et al. (SIGMOD’98)
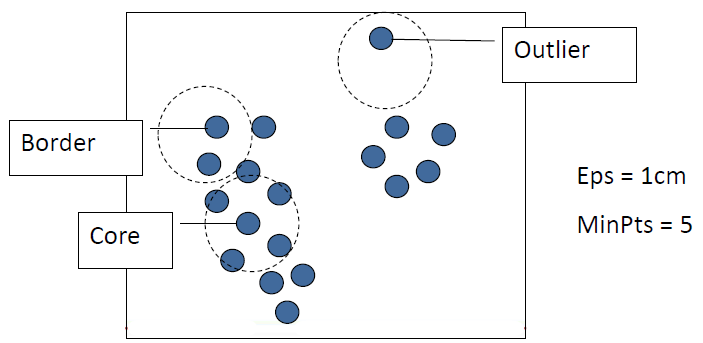
# Concepts
- Two global parameters
- 两个全局参数
- : Maximum radius or distance of the neighborhood
邻域的最大半径或距离 - : Minimum number of points in the neighborhood of that point
这个点的邻域内的最小点数
- : Maximum radius or distance of the neighborhood
- Core Object 核心对象
- its neighborhood has at least MinPts objects
它的邻域内至少有 MinPts 个对象 - Border Object 边缘对象
- object that on the border of a cluster
该对象位于簇的边界上 - Eps-Neighborhood Eps 邻域
- : { belongs to }
圆圈内和圆圈边界上所有的点,称为该数据点的 Eps 邻域,用 表示

Eps 是邻域距离的最大值,为半径
给出 EPS 值后,以 p 为中心画半径为 Eps 的圆,即为邻域
然后数圆圈内和圆圈边界上有多少个点
如果点数大于提前设定的 MinPts,那么这个点 p 就是 Core Object
因此 Core Object 由 Eps 和 MinPts 两个参数确定
上图中,假设 MinPts = 5,而图中 p 的 Eps 邻域中的点数只有 3 个,因此 p 点不是 Core Object
- Directly density-reachable 直接密度可达
- A point is directly density-reachable from a point wrt., if
点 从点 的 Eps 领域中直接密度可达,需满足以下两个条件
- belongs to
在 的 Eps 邻域中 - is core object
是核心对象
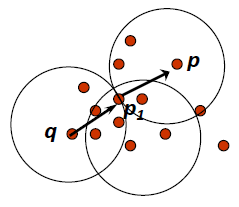
- Density-reachable 密度可达
- A point is density-reachable from a point wrt., if there is a chain of points , , such that is directly density-reachable from
如果有一条链,将 链接起来, 与 直接密度可达,则如果开始的点 , 结束的点,则点 与 wrt., 也是密度可达![]()
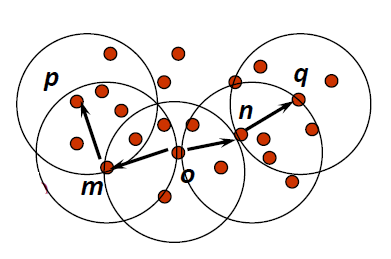
如果找到一条链,将链拆分成多个碎片,如果这些碎片都是直接密度可达,则开始的点 和结束的点 密度可达 - Density-connected 密度相关
- A point is density-connected to a point wrt., if there is a point such that both, and are density-reachable from wrt. and
假设有个点 在中间,点 和 分别与点 密度可达,此时可以说点 和 密度相关![]()

# Example (Eps, MinPts as parameters)
- There are 5 points: , , , ,
- Assume is the core object
- Directly density-reachable : and , and ,
and are in , and is core object - Density-reachable: and , and
-> -> , (, ) and (, ) are directly density-reachable
-> -> , (, ) and (, ) are directly density-reachable - Density-connected: and
There is a route, (, ), (, ) are density-reachable
# DBSCAN
DBSCAN is a popular density based clustering method
DBSCAN 是一种流行的基于密度的聚类方法It relies on a density based notion of cluster:
它依赖于以密度为基础的簇概念:
A cluster is defined as a maximal set of density connected points
簇被定义为最大的密度连接点集合It can discover clusters of arbitrary shape
它可以发现任意形状的簇
# Steps
- Randomly select a point
随机选择一个点 - Retrieve all points density-reachable from wrt and
从wrt 和 中检索所有密度可达的点- If is a core point, a cluster is formed.
如果 是一个核心点,那么就形成了一个簇。 - If is a border point, no points are density-reachable from and DBSCAN visits the next point of the database.
如果 是一个边界点,那么从 无法到达任何点,DBSCAN 将访问数据库的下一个点。
- If is a core point, a cluster is formed.
- Continue the process until all of the points have been processed.
继续此过程,直到处理完所有点。
# DBSCAN vs CLARANS
CLARANS is an efficient medoid based clustering algorithm
CLARANS 是一种高效的基于 medoid 的聚类算法

The two parameters, and , need to be carefully tuned up.
和 这两个参数需要仔细调整。
Otherwise, results may be significantly different
否则,结果可能会显著不同


# K-Means vs DBSCAN
| K-Means | DBSCAN |
|---|---|
|
|
|
|
|
|
|
|
# Hierarchical Algorithms 分层算法
- Use distance matrix as clustering criteria
使用距离矩阵作为聚类标准- does not require the No. of clusters as input, but needs a termination condition
不需要簇个数作为输入,但需要一个终止条件
- does not require the No. of clusters as input, but needs a termination condition
- In K-Means, we need to use similarity or distance metrics to measure the distance between two objects
在 K-Means 中,我们需要使用相似性或距离度量来度量两个对象之间的距离 - In hierarchical clustering, we need to measure the distance between two clusters
在层次聚类中,我们需要测量两个聚类之间的距离 - It is more complicated, since there are multiple objects within a cluster
它更复杂,因为一个簇中有多个对象
# Agglomerative Method 凝聚法
- Each individual object is considered as a single cluster at the beginning
每个单独的对象在开始时都被视为一个簇 - Choose a way to represent the cluster, such as means centroid
选择一种表示簇的方式,例如 “平均质心” - Iterate all clusters, find the two clusters with smallest distance, and merge them to a new cluster
迭代所有簇,找到距离最小的两个簇,并将它们合并为一个新簇 - Repeat the step above until all objects are grouped to a single cluster
重复上述步骤,直到所有对象都分组到一个簇中
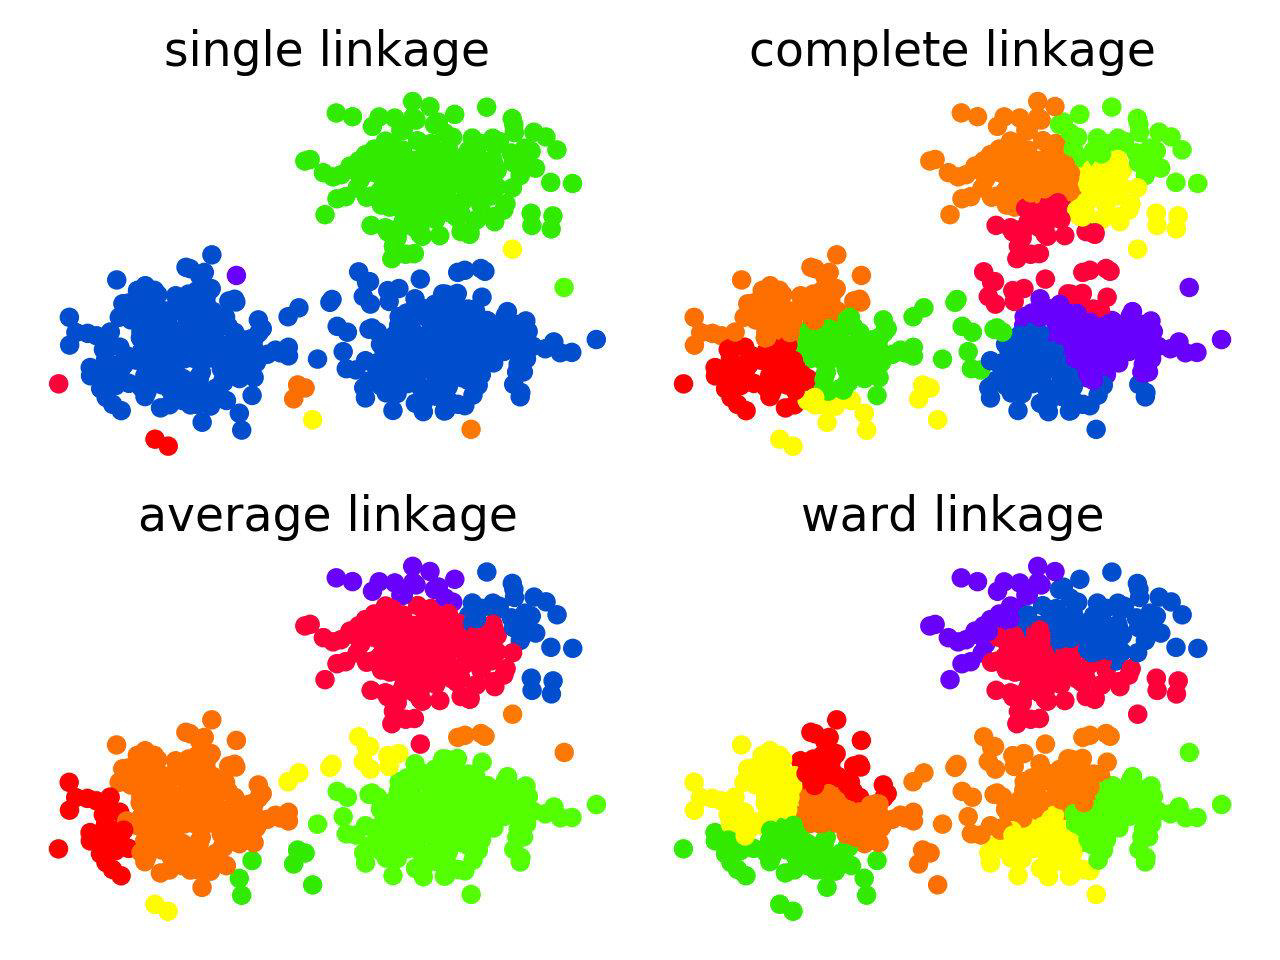
# Distance Between Clusters 簇间距离
- Single-Linkage 单连接
- Distance = distance between two closest objects from two cluster
= 距离两个簇最近的两个对象之间的距离 - Complete-Linkage 完全连接
- Distance = distance between two farthest objects from two clusters
= 距离两个簇最远的两个对象之间的距离 - Ward’s Linkage 沃德连接
- Distance = how much the sum of squares (i.e., within cluster distance) will increase when we merge them
= 当我们合并它们时,平方和(即簇内距离)将增加多少 - UPGMA
- Distance = average distance of the distance of every two objects in the two clusters
= 两个簇中每两个对象距离的平均距离 - Centroid Method 质心法
- Distance = distance between the centroids of the two clusters
= 两个簇的质心之间的距离
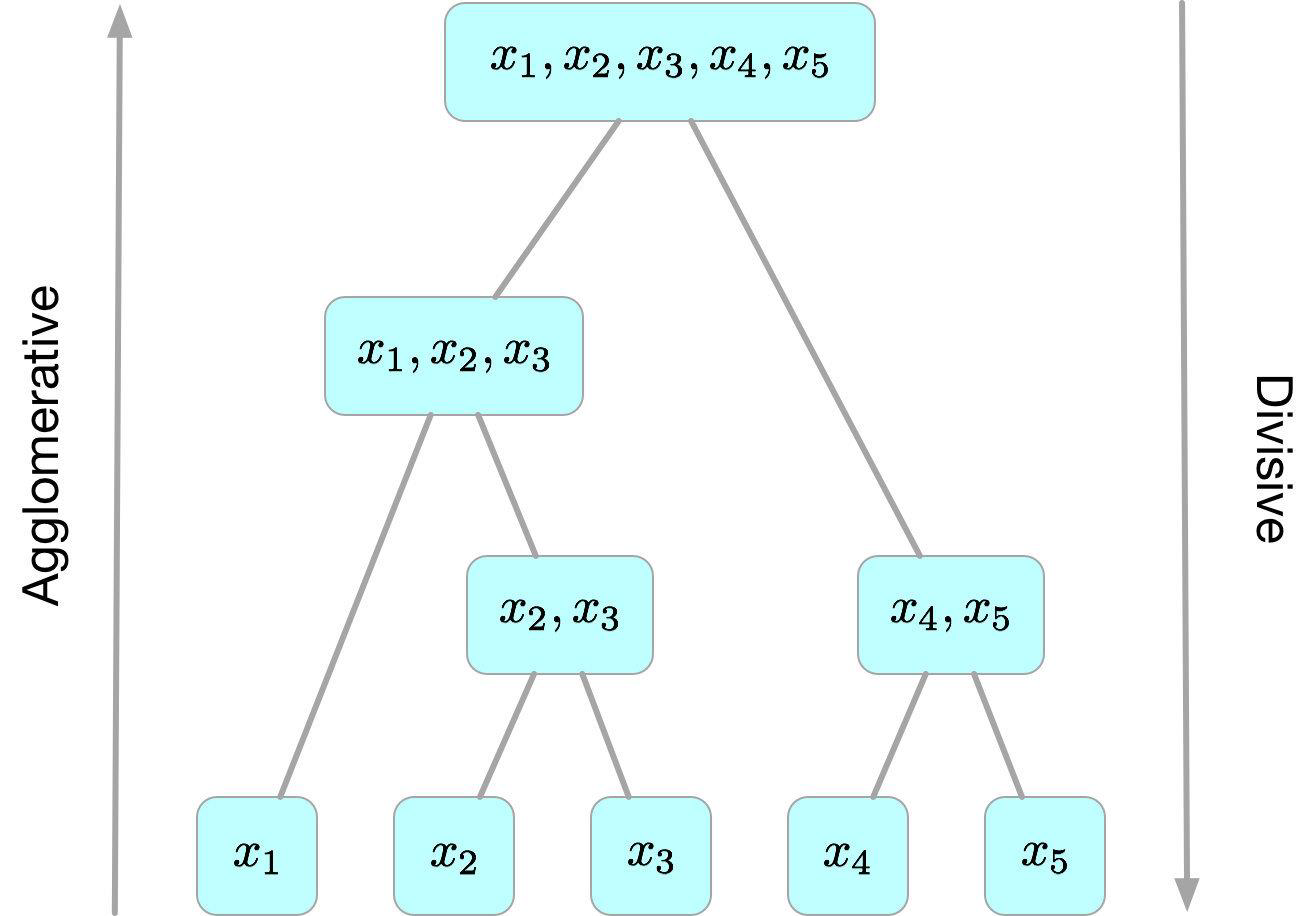
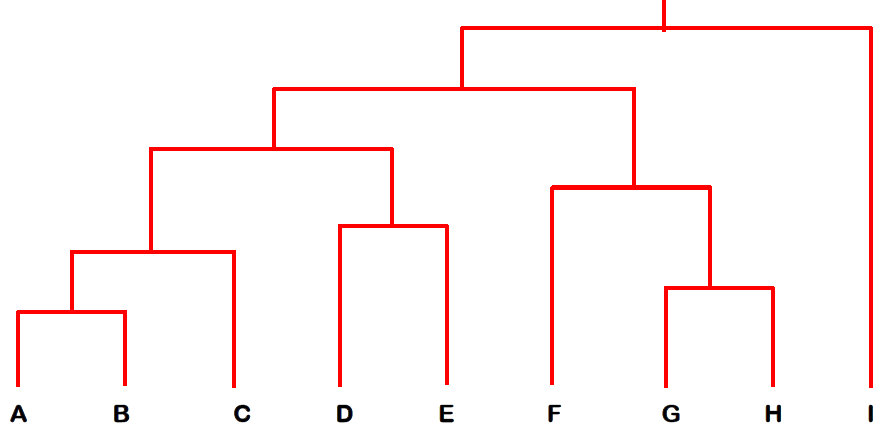
# Example
- HAC starts with unclustered data and performs successive pairwise joins among items (or previous clusters) to form larger ones
HAC 从未聚集的数据开始,在项(或之前的簇)之间执行连续的成对连接,以形成更大的项- this results in a hierarchy of clusters which can be viewed as a dendrogram
这就形成了一个簇的层次结构,可以看作是一个树状图 - useful in pruning search in a clustered item set, or in browsing clustering results
用于修剪聚集项集中的搜索,或浏览聚集结果
- this results in a hierarchy of clusters which can be viewed as a dendrogram
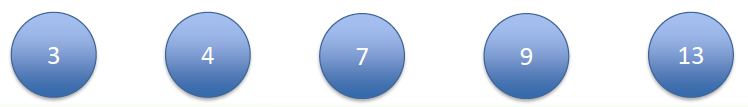
Given a list of numbers: 9, 13, 7, 3, 4
给出一个数字列表- Build hierarchical clustering tree structure from bottom to the up
建立自下而上的层次聚类树结构 - Use the mean as the representative of each cluster, Use centroid method to merge clusters
用平均值作为每个簇的代表,用质心法合并簇 - Use Manhattan distance as metric
使用曼哈顿距离作为度量方法
- Build hierarchical clustering tree structure from bottom to the up
At the beginning, each number is an individual cluster
一开始,每个数字都是一个单独的簇
[3]|[4]|[7]|[9]|[13]
--|--|--|--|--![]()
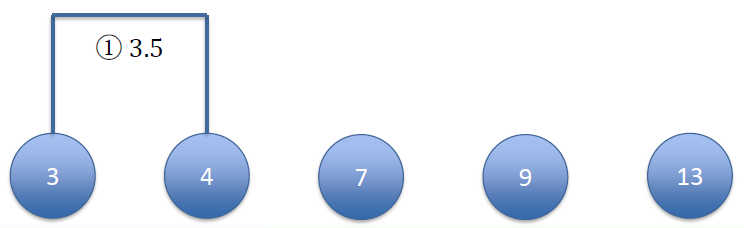
We calculate the distance between every two centroids
计算每两个质心之间的距离[3] [4] [7] [9] [13] [3] 0 [4] 1 0 [7] 4 3 0 [9] 6 5 2 0 [13] 10 9 6 4 0 And merge the two clusters with smallest distance
以最小距离合并两个簇
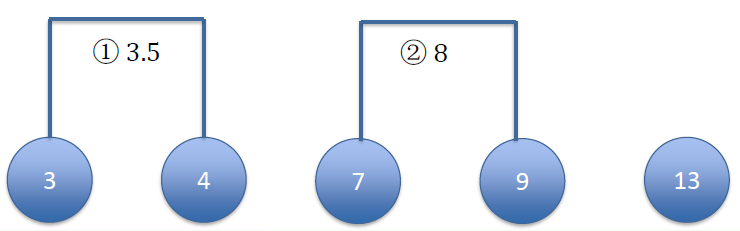
[3, 4] = 3.5|[7]|[9]|[13]
:--😐:--😐:--😐:--😐:--:![]()
Right now, we only have 4 clusters, re-calculate centroids
现在,我们只有 4 个簇,重新计算质心Next: calculate the distance between remaining clusters
下一步:计算剩余簇之间的距离[3, 4] = 3.5 [7] [9] [13] [3, 4] = 3.5 0 [7] 3.5 0 [9] 5.5 2 0 [13] 9.5 6 4 0 Merge the two clusters with smallest distance
以最小距离合并两个簇
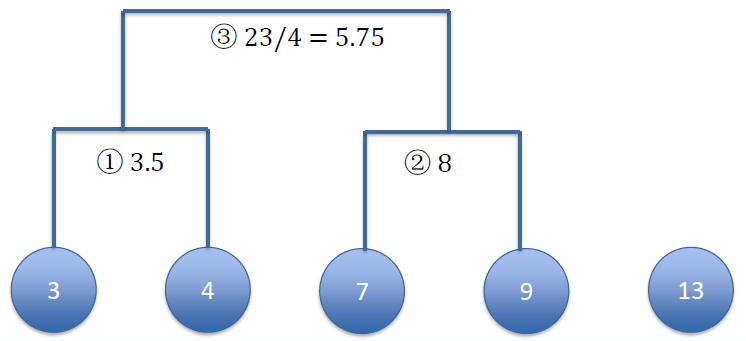
[3, 4] = 3.5|[7, 9] = 8|[13]
:--😐:--😐:--😐:--:![]()
Right now, we only have 3 clusters, re-calculate centroids
现在,我们只有 3 个簇,重新计算质心Next: calculate the distance between remaining clusters
下一步:计算剩余簇之间的距离[3, 4] = 3.5 [7, 9] = 8 [13] [3, 4] = 3.5 0 [7, 9] = 8 4.5 0 [13] 9.5 5 0 Merge the two clusters with smallest distance
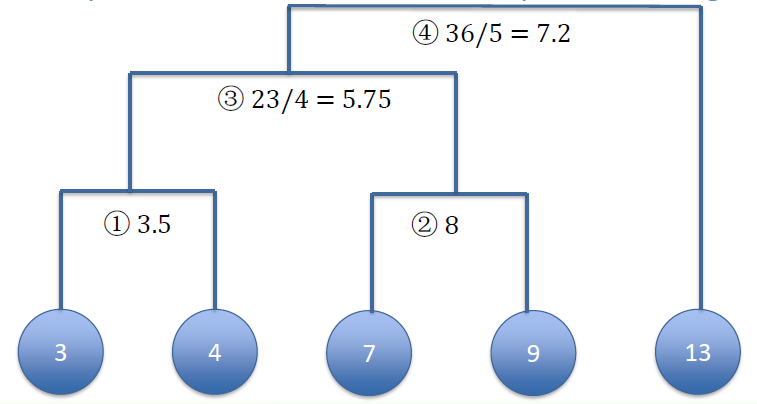
以最小距离合并两个簇![]()
Right now, we only have 2 clusters, re-calculate centroids
现在,我们只有 2 个簇,重新计算质心Next: calculate the distance between remaining clusters
下一步:计算剩余簇之间的距离Repeat until all the members are put into a single cluster
重复此操作,直到所有成员都放入一个簇![]()
# Extensions from the Example
- Each object is a one-dimension data point in our previous example
在前面的示例中,每个对象都是一维数据点 - In general, each object is a multi-dimension vector
一般来说,每个对象都是一个多维向量 - The hierarchical clustering process is still the same
分层聚类过程仍然是一样的
# How useful it is?
The hierarchical clustering tree can tell the inner structure or relationships, such as parent/children, category/subcategory.
层次聚类树可以判断内部结构或关系,例如父 / 子、类别 / 子类别。
You need to look into the objects after constructing such a hierarchical clustering tree.
在构建这样的层次聚类树之后,您需要查看对象。Hierarchical clustering results can also be used to create partitional clusters.
层次聚类结果也可用于创建分区聚类。
You just need to find the appropriate number of the clusters from the top to the bottom levels
您只需要从上到下找到适当数量的簇- You can still use SSE to find the best number of clusters
您仍然可以使用 SSE 来找到最佳数量的集群 - But again, the evaluation process is still the same
但评估过程仍然是一样的
- You can still use SSE to find the best number of clusters
# From Hierarchical to Partitional Clustering 从层次聚类到分区聚类
- The dendrogram tells u the underlying structure of the data
树状图告诉我们数据的基本结构 - We can utilize dendrogram to produce partitional clusters
我们可以利用树状图产生分区簇
For example, if you need


