# Getting to Know Data
# Types of the Data
「机器学习实战」摘录 - 两种类型的目标变量
监督学习一般使用两种类型的目标变量:数值型和标称型。
数值型目标变量则可以从无限的数值集合中取值,如 0.100、42.001、1000.743 等。数值型目标变量主要用于回归分析。
标称型目标变量的结果只在有限目标集中取值,如真与假、动物分类集合 {爬行类、鱼类、哺乳类、两栖类}。
# Qualitative (Categorical/Nominal) 定性(标称型)
- Nominal = Values are strings 值是字符串
- Special Nominal Variable 特殊标称型变量
- Binary, such as gender 二元的,如性别
- Ordinal, such as letter grade (A, B, C, F) 有序的,如字母等级
# Quantitative (Numerical) 定量(数值型)
- Discrete, we need to count to get values 离散的,需要计数来获取值
Example: number of students in the class 例子:班上的学生人数 - Continuous, we need to measure to get values 连续的,需要衡量才能得到价值
Example: the length of the table 示例:表格的长度
- If you observe that a column of numbers, it is not guaranteed that this variable is a numerical variable
观察到一列数字,但不能保证此变量是数值变量- These numbers may be encoded for some reason, for example, 1 - India, 2 - China, 3 - France, 4 - Spain
这些数字可以出于某种原因进行编码,例如,1 - 印度、2 - 中国、3 - 法国、4 - 西班牙- You need to be careful about the data types in a data set
您需要注意数据集中的数据类型
# KDD Process: Data PreProcessing
# Data Quality
Measures for data quality: A multidimensional view
数据质量的度量:多维视图
- Accuracy: correct or wrong, accurate or not
准确性:正确或错误,准确或不准确 - Completeness: not recorded, unavailable, …
完整性:未记录,不可用,… - Consistency: some modified but some not, dangling, …
一致性:有些修改了,有些没有 - Timeliness: timely update?
及时性:及时更新? - Believability: how trustable the data are correct?
可信度:数据的正确性有多可信? - Interpretability: how easily the data can be understood?
可解释性:数据有多容易被理解?
# Major Tasks in Data PreProcessing
- Data Cleaning
- Data Integration
- Data Transformation
- Data Reduction
# Data Cleaning 数据清理
Real world application data can be dirty
- Incomplete: missing values
不完整:缺失值 - Noisy: errors, outliers, e.g., salary = 10
杂乱:错误、异常值,例如,工资 = 10 - Inconsistent: 80, 90, A, B, C
前后不一致
- Incomplete: missing values
Data cleaning attempts to 数据清理尝试
- Fill in missing values 填写缺少的值
- Smooth out noisy data 消除噪音数据
- Correct inconsistencies 纠正不一致
- Remove irrelevant data 删除无关数据
# Missing Values 缺失值
- Data is not always available (missing attribute values in records)
数据不总是可用的(记录中缺少属性值)- equipment malfunction 设备故障
- deleted due to inconsistency or misunderstanding 由于不一致或误解而删除
- not considered important at time of data gathering 在收集数据时被认为不重要
# Solving Missing Data if it is numerical variable.
如果是数值型变量,则求解缺失数据。
Exp: age
如年龄
- Ignore the record with missing values 忽略缺少值的记录
- Fill in the missing values manually 手动填写缺少的值
- Fill in the missing values automatically 自动填写缺少的值
- Use a global constant to fill in missing values
使用全局常数来填充缺失的值 - Use the attribute mean value to filling missing values of that attribute
使用属性平均值来填充该属性的缺失值 - Use the attribute mean for all samples belonging to the same class to fill in the missing values
使用属于同一类的所有样本的属性均值来填充缺失值 - Build a predictive model (e.g., regression model) to predict missing values
建立预测模型 (如回归模型) 来预测缺失值
- Use a global constant to fill in missing values
# Fill in Missing Data if it is nominal variable
如果是标称型变量,则填写缺失数据。
Exp: gender
例如:性别
- Use a global constant to fill in missing values, e.g., NULL
使用一个全局常数来填充缺失的值,例如 null - Use the most frequent value to filling missing values of that attribute
使用最常见的值来填充该属性的缺失值 - Use the most frequent value belonging to the same class to fill in the missing values
使用同一类别中最常见的值填充缺少的值 - Build a predictive model (e.g., classification model) to predict missing values
建立一个预测模型 (例如,分类模型) 来预测缺失值
# Noisy Data 噪声数据
Solutions to reduce noisy data when the variance is large
方差较大时,减少噪声数据的解决方案
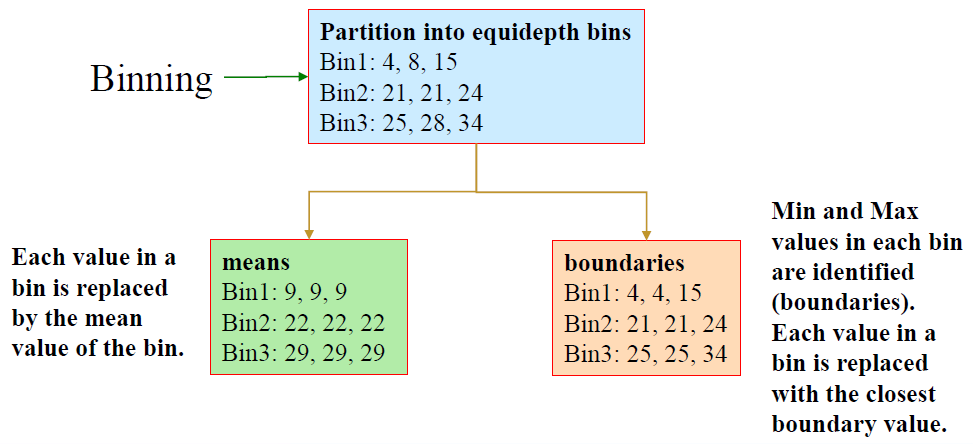
# Binning
- first sort data and partition into (equal frequency) bins
首先对数据进行分类,并划分到 (等频率的) 容器中 - then one can smooth by bin means, smooth by bin median, smooth by bin boundaries
然后可以通过容器均值、容器中值、容器边界进行平滑
Original Data for “price” (after sorting):
“价格” 的原始数据(排序后):
4, 8, 15, 21, 21, 24, 25, 28, 34
先划分为等深度的容器
再分别将 容器中的每个值都将替换为容器的平均值,或者 将每个容器中的最小值和最大值都标识出来 (即边界),容器中的每个值都用最接近的边界值替换。
- Steps in Binning
- Rank the values from smaller to larger
将值从小到大排序 - Make a decision how many bins you need, i.e., you need to decide a bin size if you want to create bins with equal length
确定需要多少个容器,也就是说,如果想创建等长的容器,需要确定容器的大小 - Create bins equally (Note: the last bin may not have the equal length)
平等地创建容器 (注意:最后一个容器的长度可能不相等) - Choose a strategy (by
meansorboundaries) to transform value in each bin
选择一个策略 (通过平均值或边界) 来转换每个容器中的值
- Rank the values from smaller to larger
# Other Methods
- Regression 回归
- smooth by fitting the data into regression functions
通过将数据拟合到回归函数来平滑
- smooth by fitting the data into regression functions
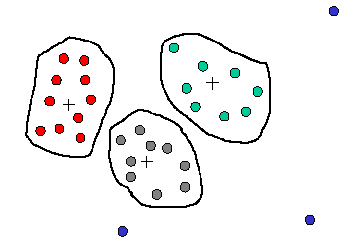
- Clustering 分类归并
- detect and remove outliers
检测并删除异常值 - Similar values are organized into groups (clusters).
相似的值被组织成组 (集群)。
Values falling outside of clusters may be considered “outliers” and may be candidates for elimination.
集群以外的值可能被认为是” 异常值”,并可能被排除。![]()
- detect and remove outliers
- Combined computer and human inspection
计算机和人工联合检查- detect suspicious values and check by human (e.g., deal with possible outliers)
检测可疑值并进行人工检查(例如,处理可能的异常值)
- detect suspicious values and check by human (e.g., deal with possible outliers)
# Data Integration 数据集成
Data analysis may require a combination of data from multiple sources into a coherent data store
数据分析可能需要将来自多个来源的数据组合成一个连贯的数据存储Challenges in Data Integration 数据集成的挑战
- Schema integration 模式集成
CID = C_number= Cust-id = cust# - Identity identification problem 身份识别问题
Bill Clinton = William Clinton - Data value conflicts 数据值冲突
different representations or scales, e.g., $ and ¥
不同的表现形式或尺度 - Redundant attributes 冗余属性
redundant if it can be derived from other attributes
如果可以从其他属性派生,则是多余的
may be able to identify redundancies via correlation analysis
可以通过相关性分析来识别冗余
- Schema integration 模式集成
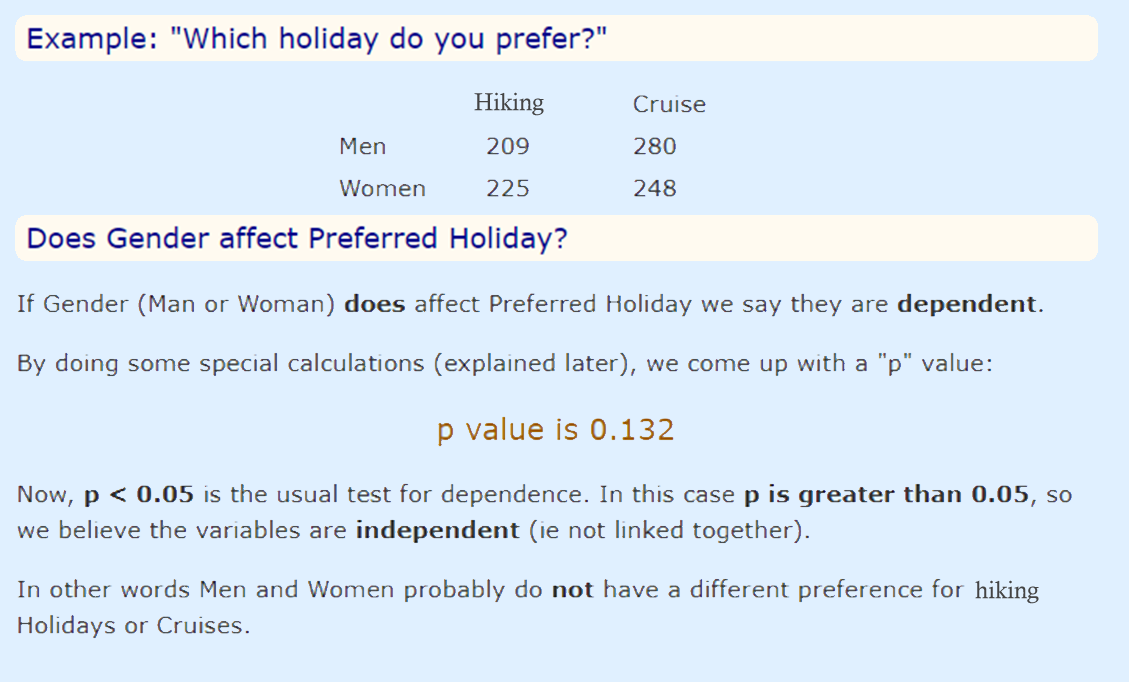
# Correlation Analysis 相关分析
If two variables have strong correlations, it means that they may change together!
如果两个变量有很强的相关性,那就意味着它们可能一起改变!
- Two numerical variables: Pearson correlation
两个数值型变量:皮尔逊相关系数 - One numerical vs one nominal variable: ANOVA
一个数值型对一个标称型变量:方差分析 - Two nominal variables
两个标称型变量- Conditional probabilities
条件概率 - Chi square test
卡方检验
- Conditional probabilities
# For Numeric Data Only: Pearson correlation 仅适用于数值数据:皮尔逊相关性
- Perfect linear correlation between X and Y:
X 和 Y 之间的完美线性相关性:
100% of the variation in Y is explained by variation in X
Y 的变化 100% 可以用 X 的变化来解释


- Weaker linear correlation between X and Y:
X 和 Y 之间的线性相关性较弱:
Some but not all of the variation in Y is explained by variation in X
Y 的部分 (但不是全部) 变化可以用 X 的变化来解释


where n is the number of tuples, and are the respective means of A and B,
σA and σB are the respective standard deviation of A and B, and Σ(aibi) is the sum
of the AB cross-product.
其中 是元组的个数,并且是 和 各自的平均值, 和 分别是 A 和 B 的标准差, 是 AB 乘积的和。
- If , A and B are positively correlated (A’s values increase as B’s).
A 和 B 是正相关的 (A 的值随着 B 的增加而增加)。
The higher, the stronger correlation.
越高,相关性越强。 - : independent 独立的
- : negatively correlated 负相关
# Between Nominal and Numerical Variables: ANOVA
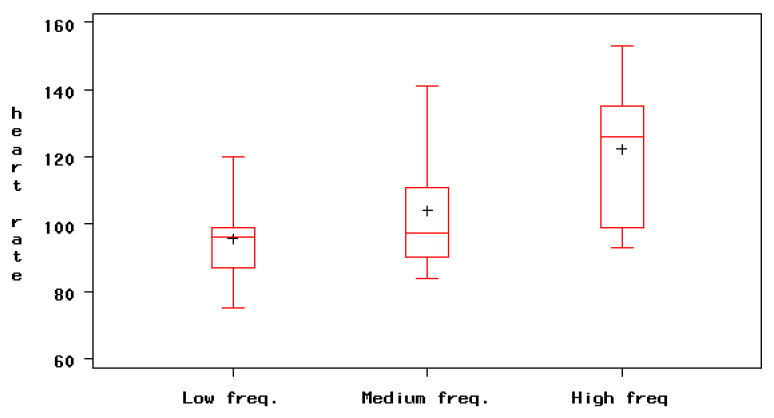
- Be sure that the observations arise from independent groups!
确保观察结果来自独立的组! - Draw side by side box plots for the groups, to visualize the differences among the groups and the within group variation
为各组绘制并排的方框图,以可视化各组之间的差异和组内变化 - Estimate the ANOVA regression model for where the errors are normally distributed and with constant standard deviation .
估计 的方差分析回归模型,其中误差 为正态分布,且具有恒定的标准偏差。
Use the regression F test to check the hypothesis that the averages are equal.
使用回归 F 检验,检验平均值相等的假设。 - Examine the residuals to verify that the model assumptions are satisfied.
检查残差,以验证是否满足模型假设。
# For Nominal Data Only: Conditional probabilities
Correlation analysis:
= 1: independent,> 1: positive correlation,< 1: negative correlation.
# For Nominal Data Only: Chi-square test
The larger the value, the more likely the variables are related.
值越大,变量关联的可能性越大。
The cells that contribute the most to the value are those whose actual count is very different from the expected count.
对 值贡献最大的单元格是那些实际计数与预期计数非常不同的单元格。
The test is applied when you have two categorical variables from a single population.
当有两个来自单个群体的标称型变量时,就会应用这个测试。
It is used to determine whether there is a significant association between the two variables.
它用于确定两个变量之间是否存在显著的关联
Null hypothesis: two variables are independent
原假设:两个变量是独立的
Coding by R and Python
- http://www.rtutor.com/elementarystatistics/goodness-fit/chi-squared-test-independence
- https://thinkingneuron.com/how-to-measure-the-correlation-between-two-categorical-variables-in-python/
# Data Transformation 数据变换
Why we need transformation? 为什么我们需要转变?
- Attribute values are at different scales 属性值在不同的尺度上
- Difficult for comparison 很难比较
- Different Data Formats 不同的数据格式
- Special requirements by specific data mining tasks 特殊要求的具体数据挖掘任务
What are the popular transformation tasks 什么是常用的转变任务
- Smoothing by binning
平滑化 - Data Normalization
数据规范化 - Data Discretization
数据离散化
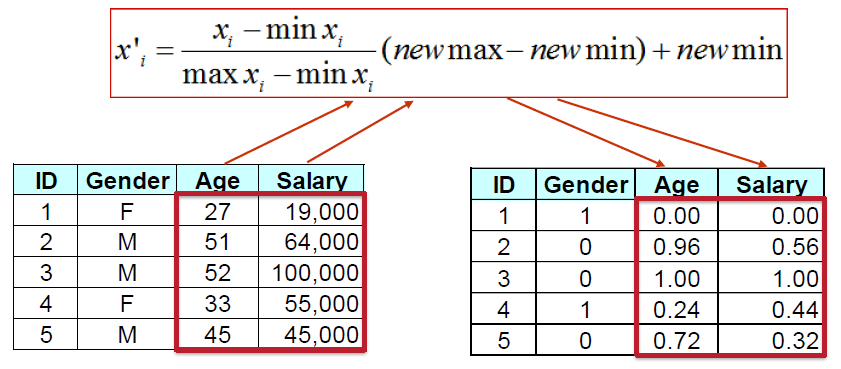
# Normalization 归一化
Sometimes, we need to use values in the same scale 有时需要使用相同尺度的值
- Min-max Normalization 极小极大归一化
can produce values in any new scale 可以在任何新的尺度下产生价值 - Z-score Normalization Z 分归一化
no controls on the new scales 新缩放没有控制 - Decimal Scaling for Normalization 十进制缩放归一化
can produce values in [-1, 1] 可产生 [-1, 1] 之间的值
# Min-max Normalization 极小极大归一化
# Z-score Normalization Z 分归一化
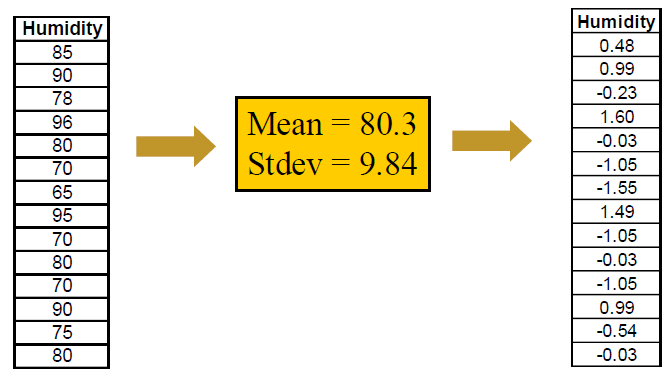
After transformation, mean = 0, Stdev = 1
# Decimal Scaling for Normalization 十进制缩放归一化
- moves the decimal point of by positions such that is the minimum number of positions moved so that absolute maximum value falls in .
将 的小数点移动 位置, 是移动位置的最小数目,使绝对最大值在 . - Ex: if ranges between 56 and 9976, j = 4 ==> v’ ranges between 0.0056 and 0.9976
如果 在 56 和 9976 之间,j = 4 = > 在 0.0056 和 0.9976 之间
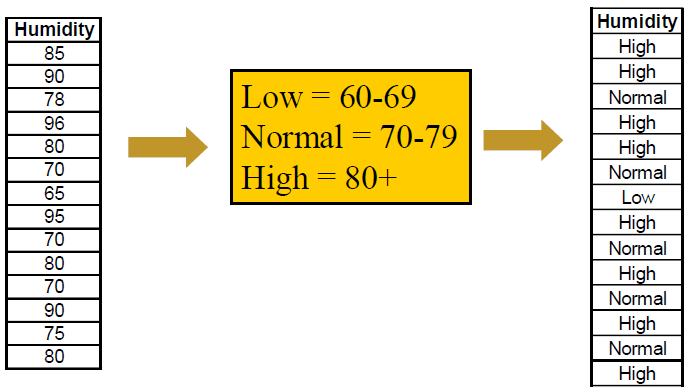
# Discretization 离散化
- From Numeric to Nominal/Ordinal Data
从数值型数据到标称型数据
- From Nominal to Numeric Data
从标称型数据到数值型数据
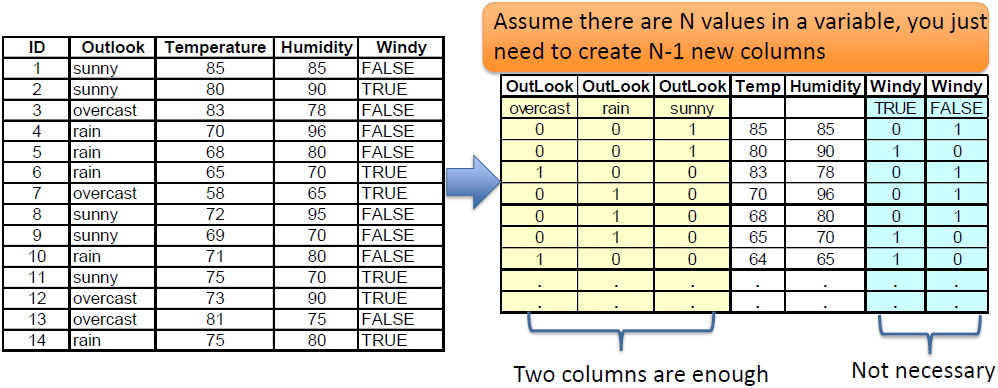
Assume there are N values in a variable, you just need to create N-1 new columns
假设变量中有 n 个值,只需要创建 n-1 个新列![]()
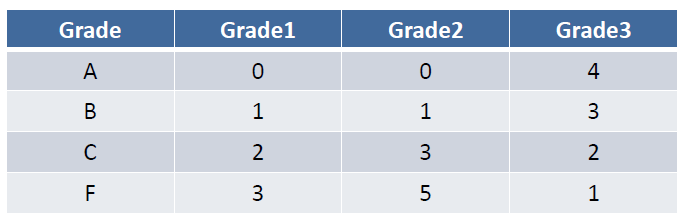
- Special case: when a nominal variable is ordinal variable
特殊情况:一个标称型变量是序数变量
In this case, you can encode them by numbers directly![]()
- Special case: when a nominal variable is ordinal variable
# Data Reduction 数据简化
- Data is often too large; reducing data can improve performance
数据通常太大;减少数据可以提高性能 - Data reduction consists of reducing the representation of the data set while producing the same (or almost the same) results
数据简化包括缩减数据集的表示,同时产生相同 (或几乎相同) 的结果 - Data reduction includes:
- Data cube aggregation 数据立方体聚合
- Dimensionality reduction 降维
- Discretization 离散化
- Numerosity reduction 数量减少
- Regression 回归
- Histograms 直方图
- Clustering 聚集
- Sampling 抽样
# Data Reduction Techniques
- Data reduction is necessary in most of the data mining tasks
在大多数数据挖掘任务中,数据简化是必要的 - Not all of the data are useful
不是所有的数据都有用 - Irrelevant data may leave negative impact on DM
不相关的数据可能会对 DM 造成负面影响
# HW1 - Basic Correlation Analysis
# Description
Correlation analysis is a basic statistical approach that can capture relationships among pairs of variables.
相关性分析是一种基本的统计⽅法,可以捕获变量对之间的关系。
Such variables ususally represent properties of objects whose values may be stored in columns of a database table.
这些变量通常表⽰对象的属性,其值可以存储在数据库表的列中。
For example, in a database containing customers, we may want to measure the correlation between the variables "Age" and "Income" or between the variables "Income" and "TotalPurchase", and so on.
例如,在包含客⼾的数据库中,我们可能想要测量变量 “Age” 和 “Income” 之间或变量 “Income” 和 “TotalPurchase” 之间的相关性,等等。
Correlations among variables can be negative or positive.
变量之间的相关性可以是负的或正的。
There are different ways of computing correlations, but in most cases, the correlation is measured as a coefficient ranging from -1 to 1.
有多种计算相关性的⽅法,但在⼤多数情况下,相关性被测量为从 -1 到 1 的系数。
A value close to 0 in this range indicates a lack of correlation.
在此范围内接近 0 的值表⽰缺乏相关性。
Values closer to the boundries -1 or 1 indicate strong negative or positive correlations, respectively. Usually (though not exclusively) strong positive or negative correlations may indicate a causal relationship between the variables.
更接近边界 -1 或 1 的值分别表⽰强烈的负相关或正相关。通常(尽管不是唯一的)强正相关或负相关可能表明变量之间存在因果关系。
For example, there may be a positive correlation between the number of hours of studying for an exam and the score obtained in that exam.
例如,考试的学习⼩时数与考试成绩之间可能存在正相关关系。
# Computing the Correlation Coefficient 计算相关系数
Given two variables and (e.g., "Age" and "Income"), the correlation coefficient for and is given by the ratio of the of and to the product of standard deviations of and . In other words:
给定两个变量 和 (例如,“Age” 和 “Income”), 和 的相关系数由 和 的协⽅差与 和 的标准差的乘积之⽐给出。换句话说:
The covariance is the average of the products of deviations from the mean in each of and :
协⽅差 是每个 和 中与平均值的偏差乘积的平均值:
In the above, each represents the value of in the th row, is the mean value of , and is the total number of values (rows).
上式中,每个 代表第 行中 的值, 是 的平均值, 是值(行)的总数
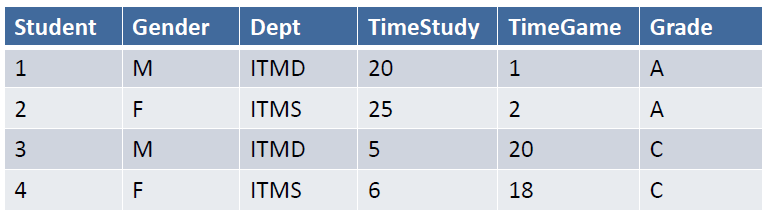
# Example
As an example consider the following table with 3 attributes X, Y, and Z.
例如,考虑下表,其中包含 3 个属性 X、 Y 和 Z。
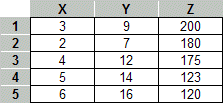
Performing the above correlation computation among all pairs of variables, would result in the following correlation matrix:
在所有变量对之间执行上述相关计算,将产⽣以下相关矩阵:
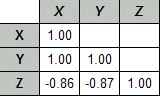
Note that the diagonal is always 1 because each variable is perfectly correlated with itself.
请注意,对⻆线始终为 1,因为每个变量都与⾃⾝完全相关。
In this case, there is also a perfect correlation between X and Y (after rounding).
在这种情况下, X 和 Y 之间也存在完美的相关性(四舍五⼊后)。
However, Z shows a strong negative correlation to both X and Y.
然⽽, Z 与 X 和 Y 都显⽰出强烈的负相关。
# Correlations in Microsoft Excel
If the data is available in an Excel spreadsheet, standard statistical functions in Excel can be used to compute correlations.
如果数据在 Excel 电⼦表格中可⽤,则 Excel 中的标准统计函数可⽤于计算相关性。
One option is to use the function CORREL in Excel directly.
一种选择是直接在 Excel 中使⽤函数 CORREL 。
This function takes as arguments two arrays (for example the data columns for X and Y in the above example) as defined by address ranges.
此函数将两个数组(例如上例中 X 和 Y 的数据列)作为参数,这些数组由地址范围定义。
The function returns the correlation coefficients as in the above example.
该函数返回相关系数,如上例所⽰。
In this case, the coefficients must be computed for each pair of variables.
在这种情况下,必须为每对变量计算系数。
Another option is to use the "Data Analysis" component of Excel.
另一种选择是使⽤ Excel 的 “数据分析” 组件。
This is available under the Toolsmenu item.
这在⼯具菜单项下可⽤。
If this item cannot be found, then it must not have been installed with Excel.
如果找不到此项⽬,则它一定没有与 Excel 一起安装。
However, it can be added from the original installation source.
但是,可以从原始安装源添加它。
Use the Excel Help files to familiarize yourself with various statistical functions, including CORREL , STDEV (for standard deviation), COVAR (for covariance), as well as with the Data Analysis tools in Excel.
使⽤ Excel 帮助⽂件熟悉各种统计函数,包括 CORREL 、 STDEV (⽤于标准差)、 COVAR (⽤于协⽅差)以及 Excel 中的数据分析⼯具。