# Objectives 目标
- Understand the difference bewteen Population and Sample
了解人群和样本之间的差异 - Know how to compute Sample Mean , Sample Median, and Sample Variance; How to interpret these measures
知道如何计算样本均值、样本中值和样本方差;如何解释这些方法 - Know how to creat a histogram and boxplot in R; Understand the interpretation of these two plots
知道如何在 R 中创建直方图和箱线图;理解这两个情节的解释
# Introduction to Statistics 统计学概论
- What is statistics? 什么是统计?
- Statistics is the study of the collection, organization, analysis, and interpretation of data.
统计学是对数据的收集、组织、分析和解释的研究。
# Basics of statistics 统计学基础
- Population 人群
- the entire group of individuals that we want information about.
我们想要了解的整个个人群体。 - Sample 样本
- a part of the population that we actually examine in order to gather information about the whole population.
我们实际检查的一部分人口,以收集有关整个人口的信息。
# Types of statistics 统计类型
- Descriptive statistics 描述性统计
- utilizes numerical and graphical methods to look for patterns in a data set, to summarize the information revealed in a data set, and to present the information in a convenient form.
利用数值和图形方法在数据集中寻找模式,总结数据集中揭示的信息,并以方便的形式呈现信息。 - Inferential statistics 推论统计
- use a fact about a sample to estimate the truth about the whole population.
使用关于样本的事实来估计关于整个总体的真相。

# Descriptive Statistics 描述性统计
General two types of data:
一般有两种类型的数据:
- Qualitative data 定性数据
- observations that cannot be measured on a numerical scale. They can only be classified into one of a group of categories.
无法在数字尺度上测量的观察结果。它们只能归入一组类别中的一个。
Example: species of fish, eye color, marital status etc.
例如:鱼的种类、眼睛颜色、婚姻状况等。 - Quantitative data 定量数据
- measurements that are recorded on a naturally occurring numerical scale.
以自然发生的数字标度记录的测量值。
Example: height of person, score of test, etc.
例如:人的身高、考试成绩等。
# Numerical Methods 数值方法
- Consider a quantitative dataset with observations, denoted as .
定义一个定量数据集 。
# Location Measures 位置测量
- Sample Mean 样本均值
- arithmetic average, denoted by
算术平均值,用 表示。
The corresponding population parameter is population mean, denoted by .
对应的总体参数为总体均值,表示为
- Sample median 样本中位数
- middle number when the observations are arranged in ascending order, noted by .
当观测值按升序排列时的中间数,记为 。
Median is less sensitive than mean to extremely large or small observations, which is good.
中值对极大或极小的观察值不如均值敏感。
For example, a dataset , the sample mean is and the sample median is .
例如,一个数据集 ,样本均值是 ,样本中位数是 .
If the observation 4 is changed to 18, then the sample mean becomes , while the sample median stays unchanged as .
如果将值 4 更改为 18,则样本均值变为,而样本中位数保持不变仍为 .
# Variability Measures 变异性度量
- Sample range 样本范围
- measure of variability,
可变性的度量 - Sample variance 样本方差
- measure of variability, spread out, denoted by
变异性的度量,分布,用 表示
The corresponding population parameter is population variance, denoted as .
对应的总体参数为总体方差,记为 。
- Sample standard deviation 样本标准差
- , common way for measuring how far observations are away from the mean.
测量观测值与均值相差多远的常用方法。
The corresponding population parameter is the population standard deviation, denoted as .
对应的总体参数为总体标准差,记为 .
# 使用 R 来计算
Consider a tiny dataset with three observations 0, 1 and 5. Find the sample mean, sample median, sample variance, and sample standard deviation.
考虑一个包含三个观测值 0、1 和 5 的小数据集。找出样本均值、样本中值、样本方差和样本标准差。How to use R find the sample mean, sample median, and sample variance?
如何使用 R 求样本均值、样本中位数和样本方差?Let's check a very small dataset
iris, which comes with the default installation of R. To check the sample mean and sample median of the data, just typesummary(iris).
检查一个非常小的数据集iris,它随 R 的默认安装一起提供。要检查数据的样本均值和样本中值,只需键入summary(iris)。summary # Generate mean, median, percentile for numeric attributes and frequency for categorical attributessummary(iris)
  Sepal.Length    Sepal.Width     Petal.Length    Petal.Width          Species
Min.   :4.300   Min.   :2.000   Min.   :1.000   Min.   :0.100   setosa    :50
1st Qu.:5.100   1st Qu.:2.800   1st Qu.:1.600   1st Qu.:0.300   versicolor:50
Median :5.800   Median :3.000   Median :4.350   Median :1.300   virginica :50
Mean   :5.843   Mean   :3.057   Mean   :3.758   Mean   :1.199
3rd Qu.:6.400   3rd Qu.:3.300   3rd Qu.:5.100   3rd Qu.:1.800
Max.   :7.900   Max.   :4.400   Max.   :6.900   Max.   :2.500
Use
varto find the variance of one attributePetal.Width.
使用var找到属性Petal.Width的方差。variance # Generate variance for numeric attributesvar(iris$Petal.Width)
[1] 0.5810063
# Graphical Methods 图形方法
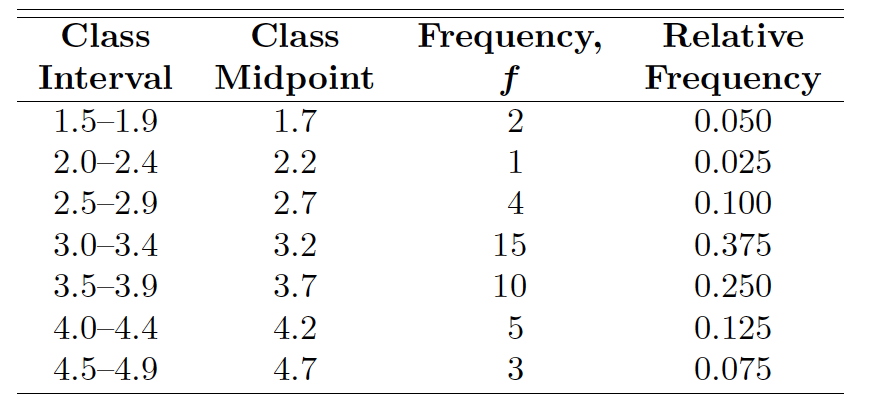
# Frequency table 频率表
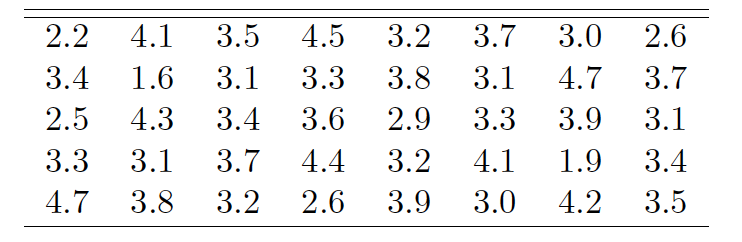
The following is a table, which specifies the life of 40 similar car batteries recorded to the nearest tenth of a year. The batteries are guaranteed to last 3 years.
下表列出了 40 个类似汽车电池的寿命,记录到最接近的十分之一年。电池保证可以使用 3 年。
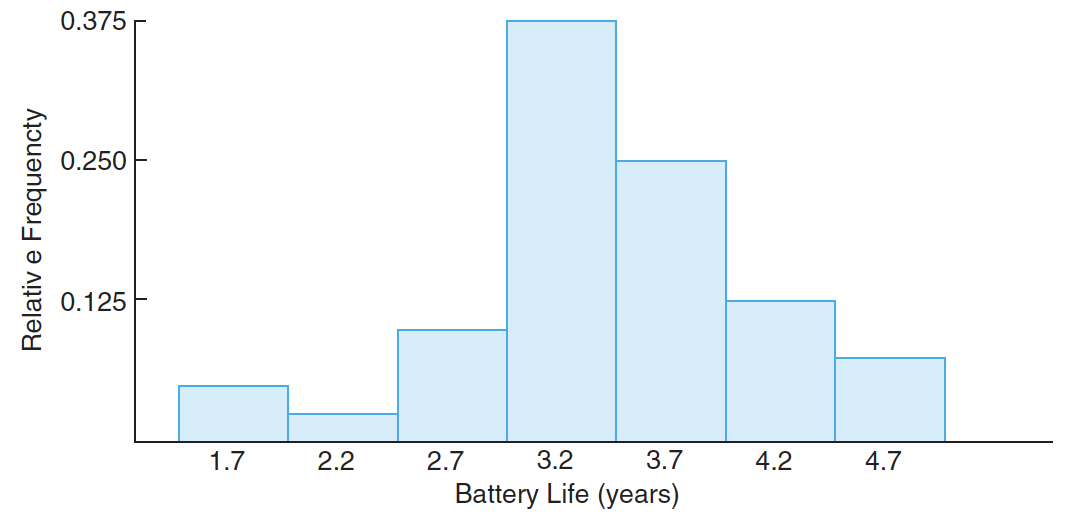
# Histogram 直方图
Graphically displays the contents in the frequency table
以图形方式显示频率表中的内容The class intervals in the frequency table form the scale of the horizontal axis.
频率表中的类间隔形成了横轴的刻度。A vertical bar is placed over each class interval, with height equal to either the class frequency or class relative frequency.
在每个班级间隔上放置一个垂直条,其高度等于班级频率或班级相对频率。Used to plot the density of the data
用于绘制数据的密度

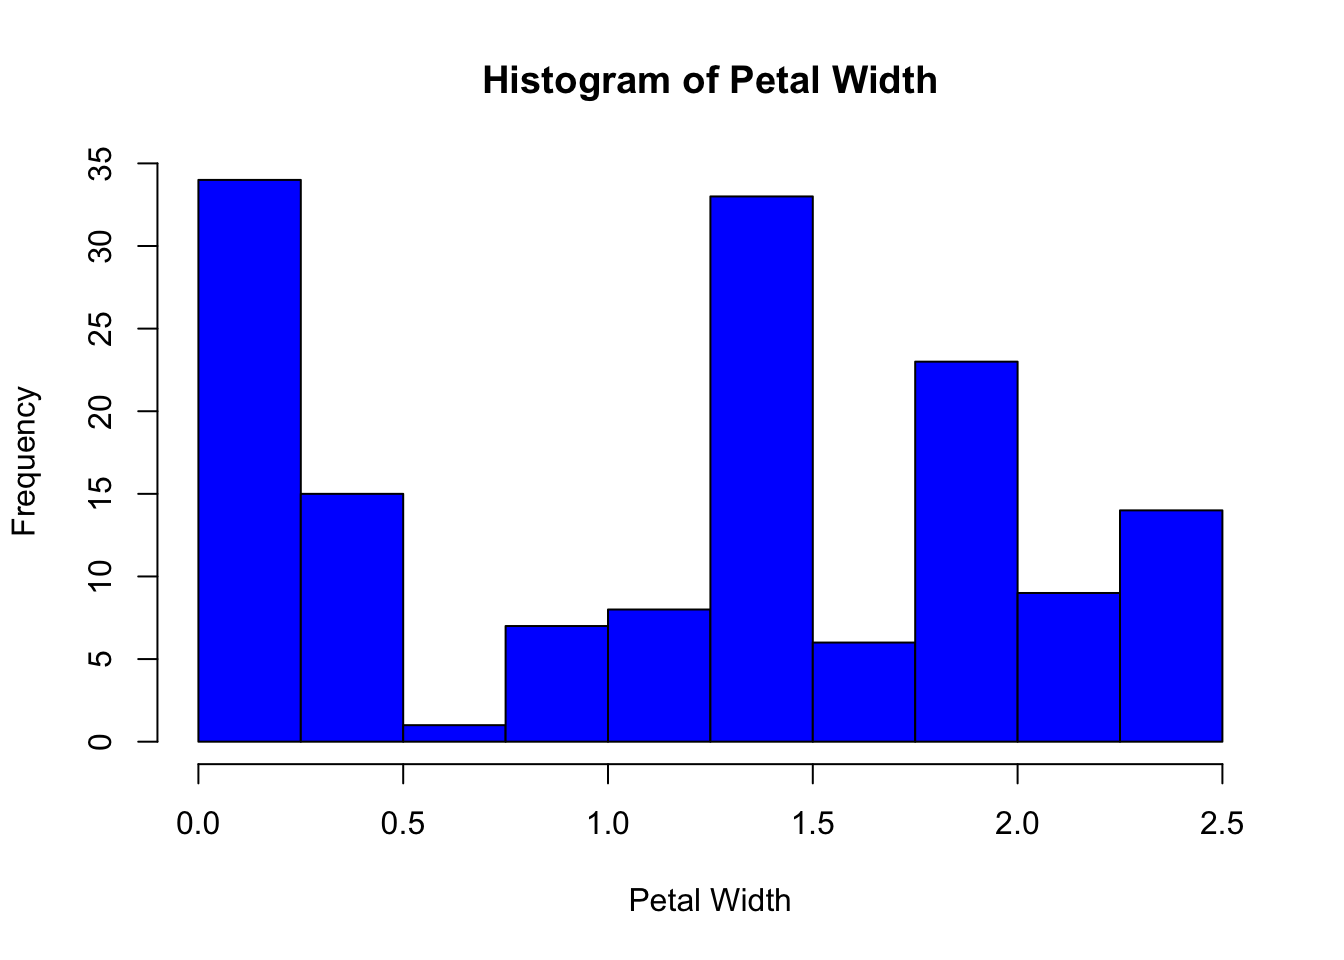
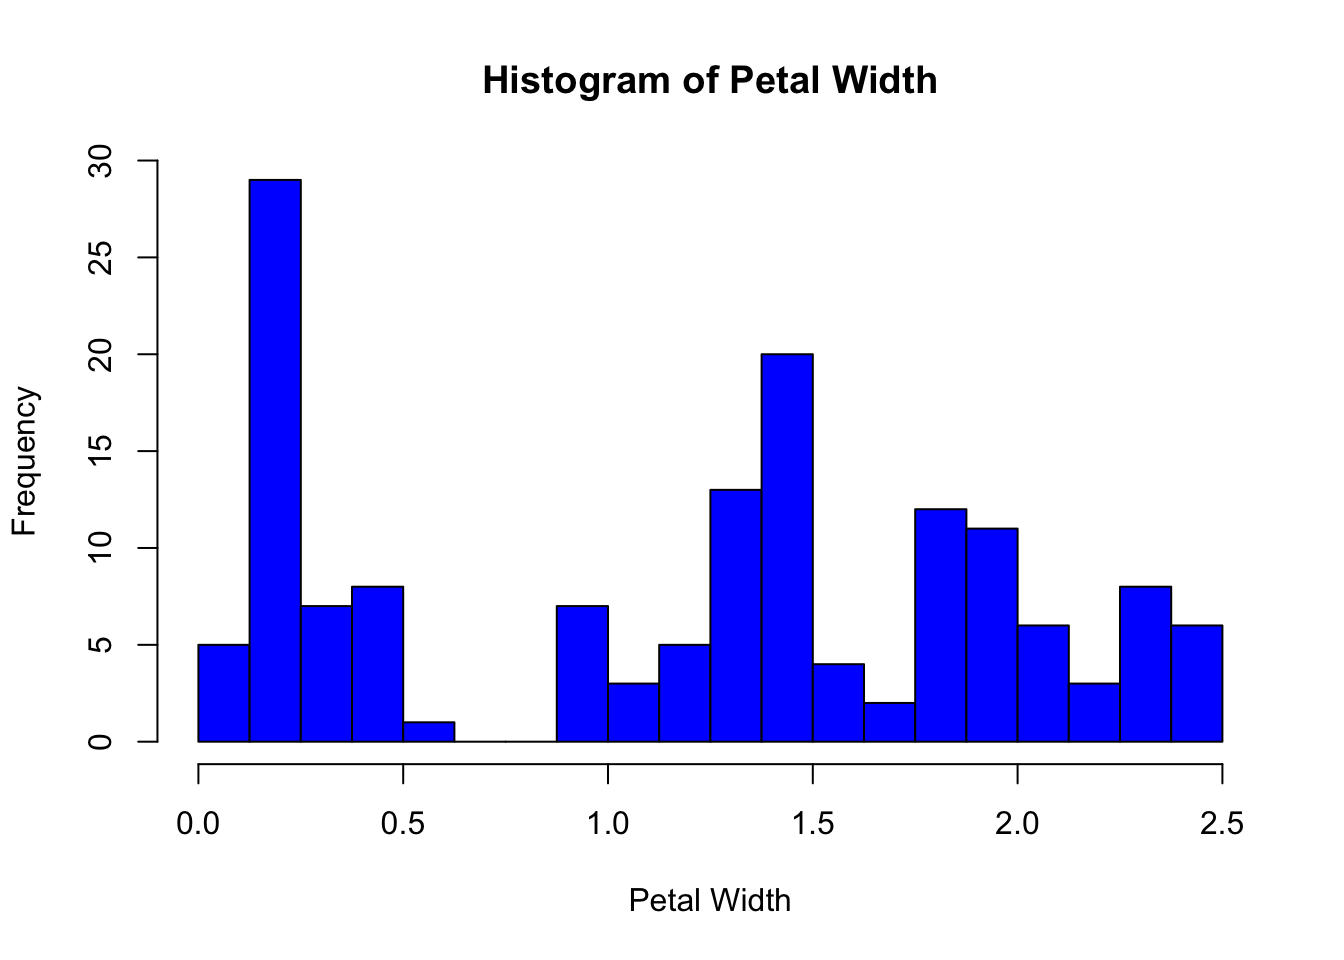
How to plot histogram in R? Use the function
hist. The following is a histogram ofPetal.Widthinirisdataset.
如何在 R 中绘制直方图?使用函数hist。下面是直方图Petal.Width的iris数据集。irisHisto #Histogram of Petal Width with 10 binshist(iris$Petal.Width, breaks = seq(0,2.5,l=11),col = "blue", main = "Histogram of Petal Width",xlab="Petal Width")
![]()
irisHisto #Histogram of Petal Width with 20 binshist(iris$Petal.Width, breaks = seq(0,2.5,l=21),col = "blue", main = "Histogram of Petal Width",xlab="Petal Width")
![]()
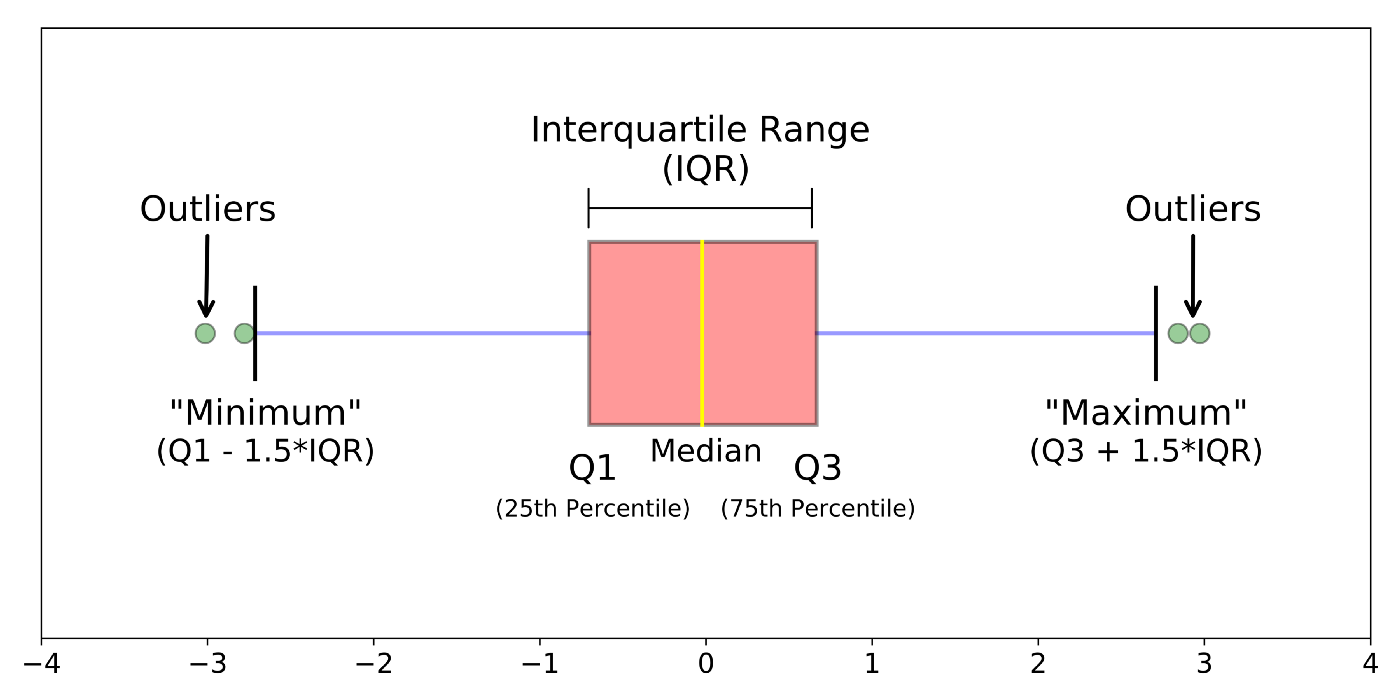
# Boxplot 箱形图
Graphically depicting groups of numerical data through their quartiles.
通过四分位数以图形方式描述数字数据组。![]()
- first quartile
Q1/25th Percentile第一个四分位数 - the middle number between the smallest number (not the “minimum”) and the median of the dataset.
最小数字(不是 “最小值”)和数据集的中位数之间的中间数字。 - third quartile
Q3/75th Percentile第三四分位数 - the middle value between the median and the highest value (not the “maximum”) of the dataset.
数据集的中位数和最大值(不是 “最大值”)之间的中间值。 - interquartile range
IQR四分位距 - 25th to the 75th percentile.
第 25 到第 75 个百分位数。 - “maximum”
- “minimum”
- first quartile
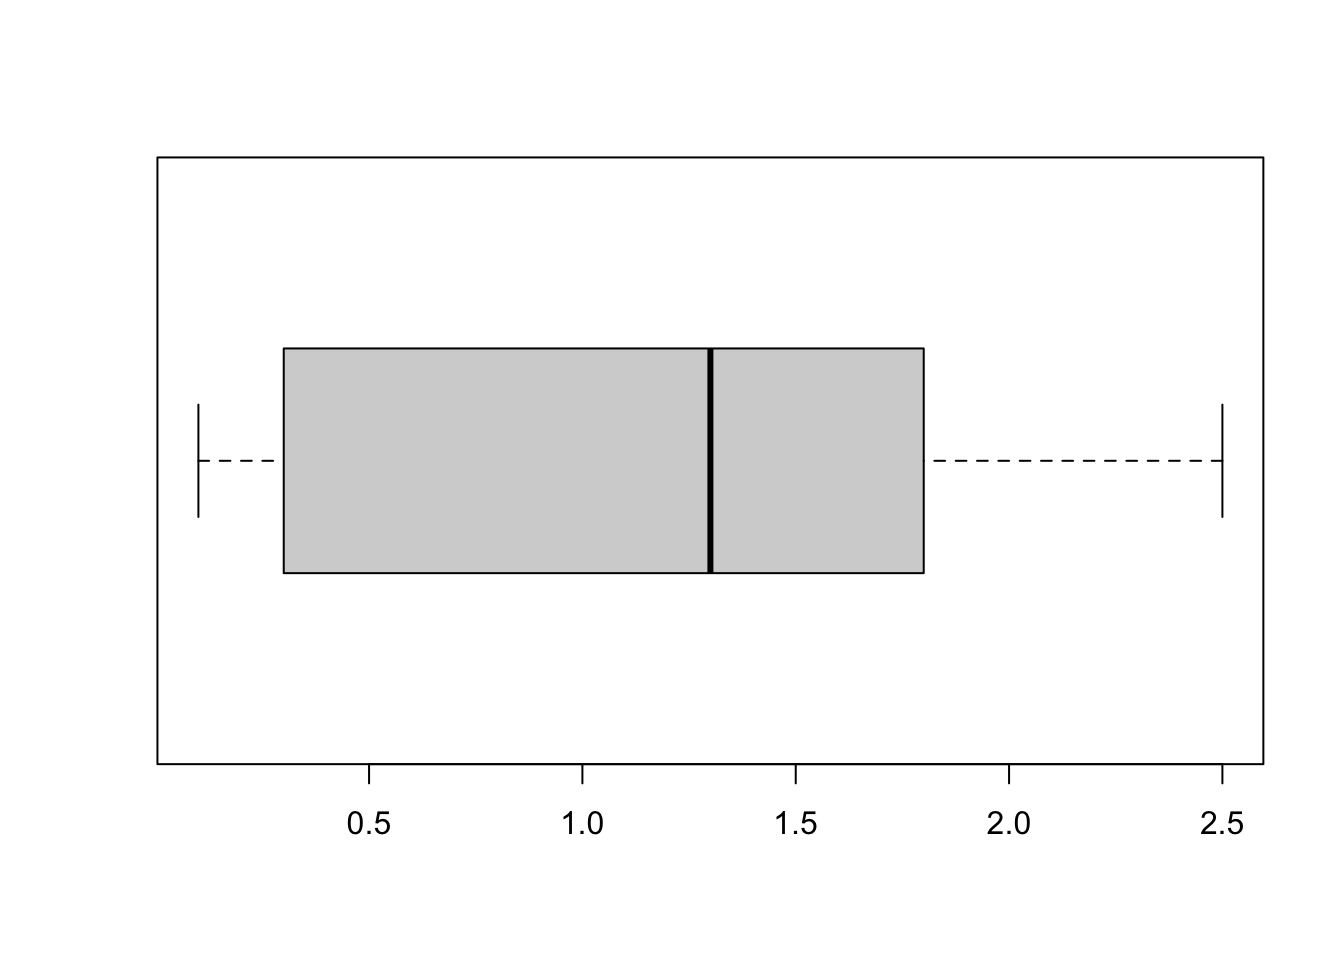
Use the
boxplotfunction to create a boxplot of Petal Width.
使用boxplot函数创建花瓣宽度的箱线图。boxplot(iris$Petal.Width, horizontal = TRUE)
![]()
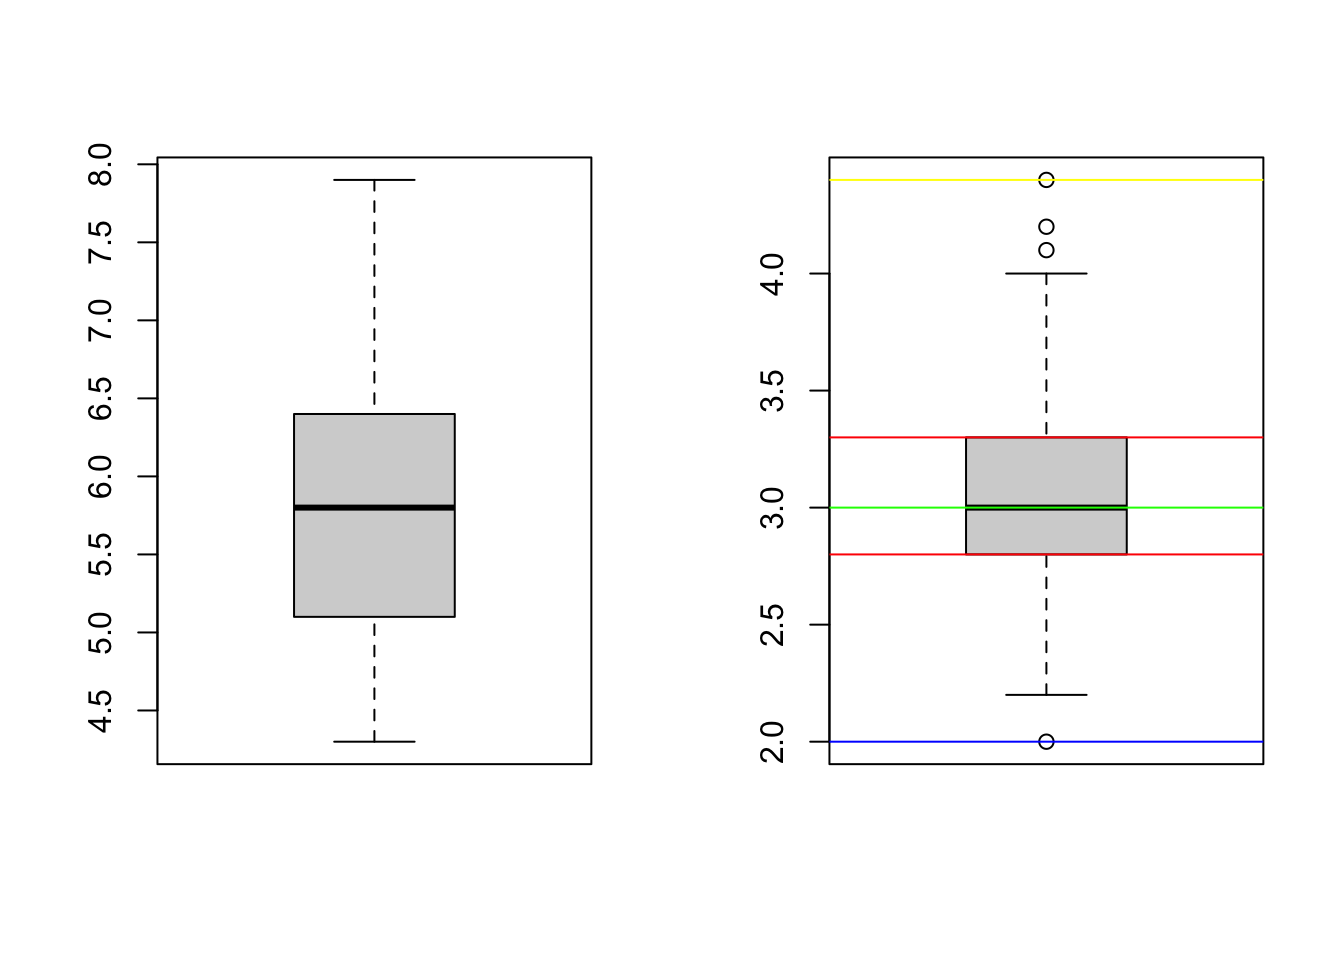
par(mfrow = c(1, 2))creates a grid of size 1x2 for plots; it divides the plot area into a grid so you see several plots on the same page as opposed to separately. Try changing the 1 and the 2 to something else!par(mfrow = c(1, 2))为绘图创建一个大小为 1x2 的网格;它将绘图区域划分为一个网格,因此你可以在同一页面上看到多个绘图,而不是单独显示。尝试将 1 和 2 更改为其他内容!par(mfrow = c(1, 2))
boxplot(iris$Sepal.Length)
boxplot(iris$Sepal.Width)
abline(h = min(iris$Sepal.Width), col = "Blue")
abline(h = max(iris$Sepal.Width), col = "Yellow")
abline(h = median(iris$Sepal.Width), col = "Green")
abline(h = quantile(iris$Sepal.Width, c(0.25, 0.75)), col = "Red")
![]()
# In-class exercise 课堂练习
# Variance 方差
- Open RStudio on your machine
- File > New File > R Markdown ...
- Modify
summary(cars)in the first code block to find the variance ofSepal.Length
在第一个代码块中修改summary(cars)以找到Sepal.Length的方差 - Click
Knit HTMLto produce an HTML file. - Save your Rmd file as
InClassEx2.Rmd
# Histogram 直方图
- Keep working on your Rmd file
InClassEx2.Rmd
继续处理你的 Rmd 文件InClassEx2.Rmd - Use the
histfunction to create a histogram of Petal Length.
使用该hist函数创建花瓣长度的直方图。
# Boxplot 箱线图
Keep working on your Rmd file
InClassEx2.RmdUse the
boxplotfunction to create a boxplot of Petal Length
使用该 boxplot 函数创建花瓣长度的箱线图Type your conclusion of outliers of
Petal.Lengthin your Rmd file
在你的 Rmd 文件中输入Petal.Length离群值的结果Use
par(mfrow = c(1, 2))to combine the boxplot ofPetal.LengthandPetal.Width
使用par(mfrow = c(1, 2))结合Petal.Length和Petal.Width到箱线
# A Comprehensive Exerices 综合练习
Add the follwoing code block to
InClassEx2.Rmd
将以下代码块添加到 InClassEx2.RmdcarBatteries <- c(
2.2,4.1,3.5, 4.5, 3.2, 3.7, 3.0, 2.6, 3.4, 1.6, 3.1, 3.3, 3.8, 3.1, 4.7, 3.7, 2.5,
4.3, 3.4, 3.6, 2.9, 3.3, 3.9, 3.1, 3.3, 3.1, 3.7, 4.4, 3.2, 4.1, 1.9, 3.4, 4.7,
3.8, 3.2, 2.6, 3.9, 3.0, 4.2, 3.5
)Find the
mean,variance,stdofcarBatteriesmean(carBatteries)
var(carBatteries)
sd(carBatteries)
Find the
mean,variance,stdofcarBatterieswhencarBatteries 3carBattGT3 <- carBatteries[carBatteries>3]
mean(carBattGT3)
var(carBattGT3)
sd(carBattGT3)
Create a
histogramofcarBatteries
创建 carBatteries 的 histogramhist(carBatteries)
Create a
boxplotofcarBatteries
创建 carBatteries 的 boxplot